Tech Stocks Fluctuate as Nasdaq Declines in AI Chip Competition
- Authors

- Name
- MarketVibe Team
- @1marketvibe
Tech Stocks Fluctuate as Nasdaq Declines in AI Chip Competition
The tech sector is experiencing significant fluctuations as the Nasdaq Composite Index faces downward pressure. This volatility is largely driven by intensifying competition in the AI chip market, with major players like Nvidia and Alphabet at the forefront. According to MarketVibe's proprietary Enhanced CW Index, which operates on a 0-10 scale to provide a 4-6 week early warning of market corrections by tracking institutional gold flows and market breadth, the current reading is 6.5. This level is below the critical 7.0 threshold, indicating a moderate risk environment. Historically, when the CW Index hit 7.1 in March 2023, markets fell 8.3% over the following month, underscoring the importance of monitoring this index closely.
Learn more about how CW Index works at 1marketvibe.com.
Market Reaction
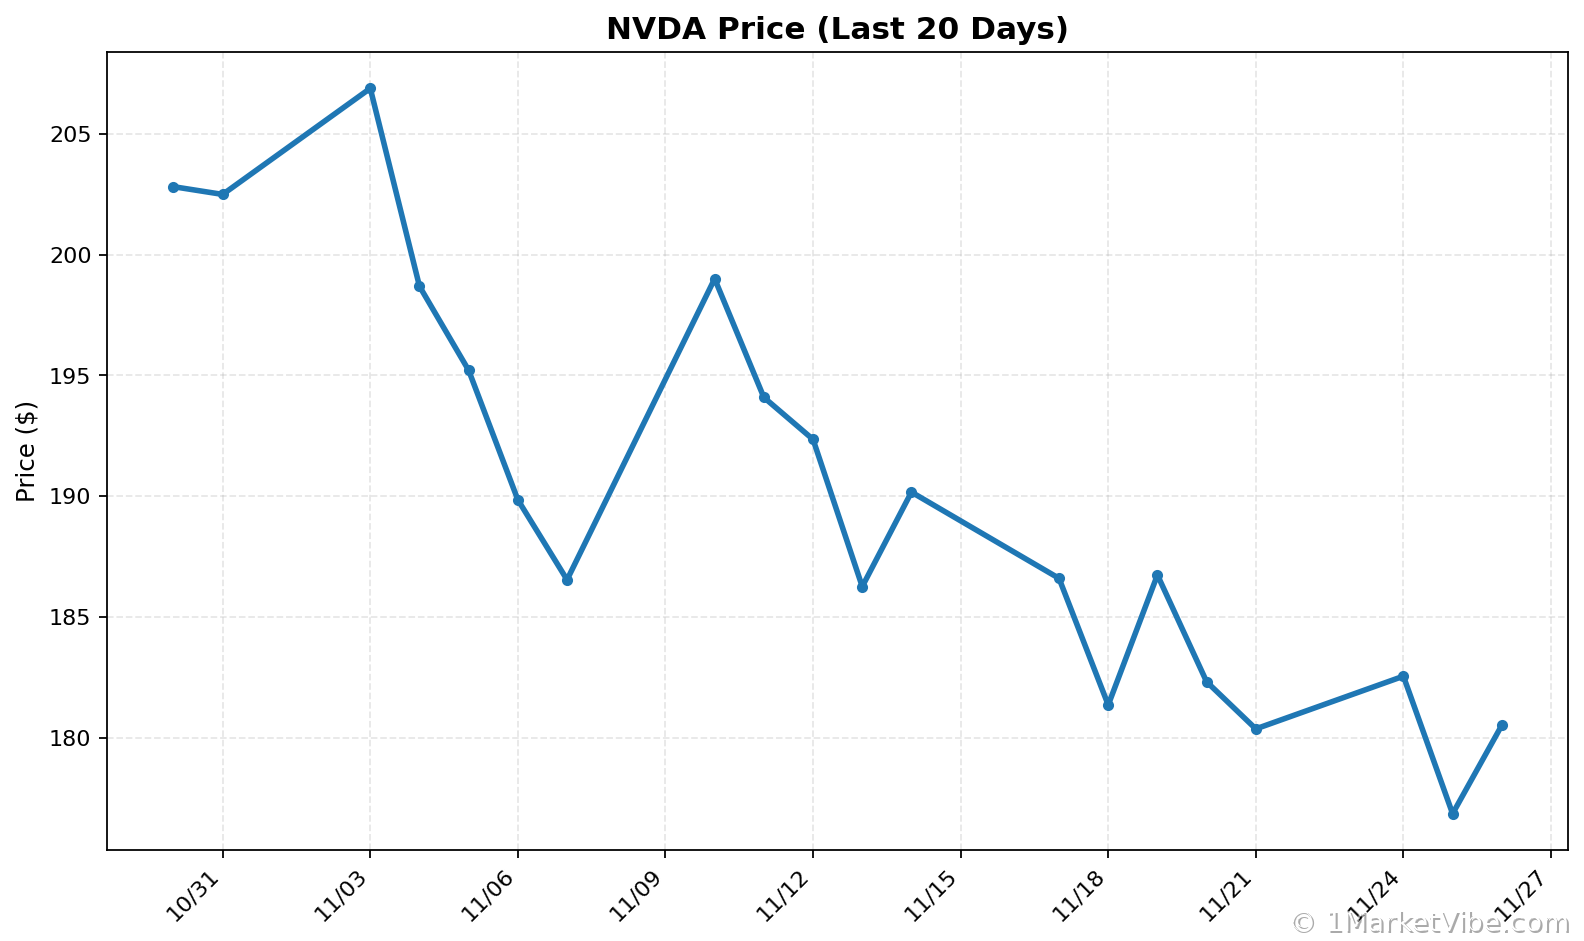
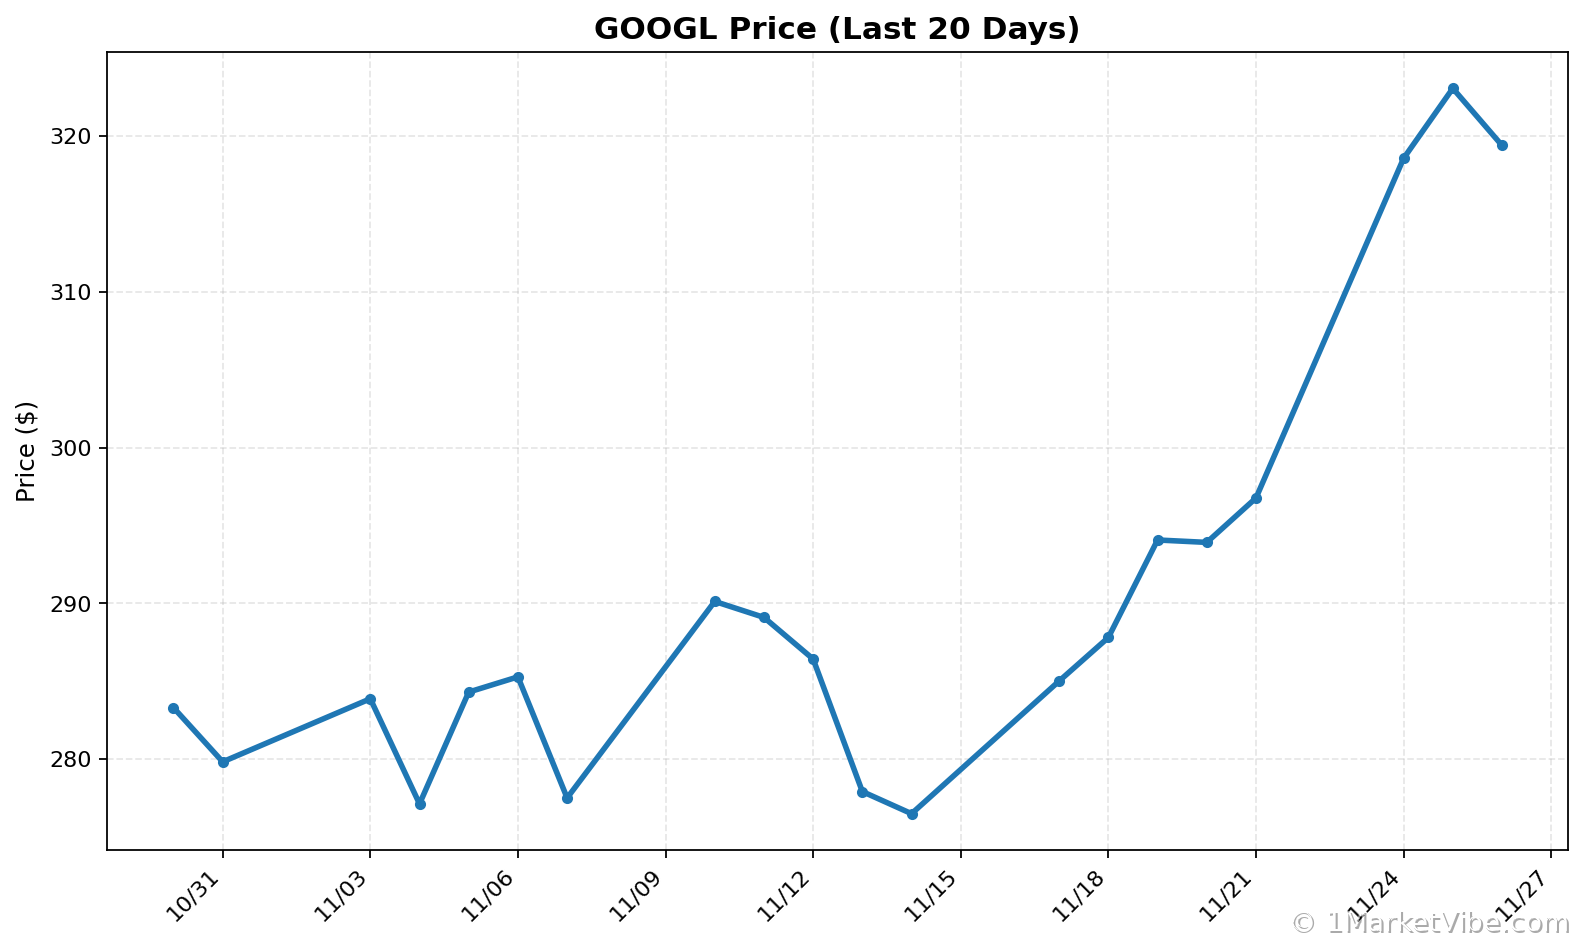
The Nasdaq's recent decline highlights the market's sensitivity to shifts within the tech sector, particularly concerning AI chip competition. Nvidia, a leader in the AI chip space, has seen its stock price dip as Alphabet makes strides in developing competitive AI technologies. This rivalry has sparked investor concern, contributing to the broader market's volatility. MarketVibe's CW Index suggests that while the current reading of 6.5 indicates moderate risk, investors should remain vigilant for any upward movement towards the 7.0 warning threshold.
AI Chip Rivalry
The AI chip market is rapidly evolving, with companies like Nvidia and Alphabet investing heavily in research and development to gain a competitive edge. This rivalry is not only influencing stock prices but also reshaping investor sentiment across the tech sector. MarketVibe tracks these developments closely, using its proprietary system to provide insights into potential market shifts. The gold component of the CW Index offers a unique early warning, allowing investors to anticipate market corrections with a 4-6 week lead time.
Sector Volatility
The tech sector's volatility is further exacerbated by broader economic factors, including interest rate fluctuations and geopolitical tensions. As these elements interplay, MarketVibe's Enhanced CW Index serves as a crucial tool for investors seeking to navigate this complex landscape. The current reading of 6.5, while not at the warning level, suggests that investors should be prepared for potential shifts. Historical patterns show that when the CW Index approaches 7.0, market corrections often follow.
Investor Sentiment
Investor sentiment remains cautious as the tech sector grapples with these challenges. The ongoing AI chip rivalry and its impact on major tech stocks like Nvidia and Alphabet are key factors influencing market dynamics. According to MarketVibe data, the current CW Index level indicates a need for strategic positioning and risk management. Investors are advised to monitor the index closely, particularly if it trends towards the 7.0 threshold, which historically signals increased market volatility.
Future Considerations
Looking ahead, investors should consider the potential implications of the AI chip rivalry on the broader market. MarketVibe's 4-6 week early warning capability provides a strategic advantage, enabling investors to anticipate and respond to market shifts proactively. As the CW Index remains at 6.5, it is crucial to watch for any movements that could indicate heightened risk. The gold component of the index continues to offer valuable insights, helping investors make informed decisions in a rapidly changing market environment.
MarketVibe Decision Edge™: Your Action Plan
MarketVibe's Decision Edge™ Method simplifies complex market signals into three clear steps: Glance → Learn → Act. This proprietary framework is designed to turn market intelligence into actionable decisions.
🔍 Glance (10-Second Takeaway)
- Current CW Index reading: 6.5, indicating moderate risk.
- Overall market status: Yellow flag, suggesting caution.
- Key metric to watch: Movement towards the 7.0 threshold.
📚 Learn (2-Minute Deep Dive)
The current market environment is shaped by the ongoing AI chip rivalry between Nvidia and Alphabet. This competition is driving significant fluctuations in tech stocks, impacting the broader Nasdaq index. Historically, similar scenarios have led to market corrections, as evidenced by the CW Index's past performance. MarketVibe's proprietary system provides a unique advantage by incorporating gold flows into its early warning signals, offering investors a 4-6 week lead time to adjust their strategies. As the CW Index remains at 6.5, it is essential to monitor any upward trends that could signal increased volatility.
⚡ Act (Specific Steps)
- For conservative investors: Maintain current positions but prepare to reduce exposure if the CW Index approaches 7.0.
- For aggressive investors: Consider short-term hedging strategies to mitigate potential losses.
- For balanced portfolios: Reassess sector allocations, particularly within tech, to ensure alignment with risk tolerance.
- Risk management: Set stop-loss orders and review portfolio diversification to protect against unexpected market shifts.
Access MarketVibe's full Decision Edge framework at 1marketvibe.com →
Conclusion
In conclusion, the tech sector's current volatility, driven by the AI chip rivalry, underscores the importance of strategic market analysis. MarketVibe's Enhanced CW Index and Decision Edge™ Method provide investors with the tools needed to navigate these challenges effectively. By leveraging these insights, investors can make informed decisions, manage risk, and capitalize on market opportunities. As always, staying informed and proactive is key to successful investing.
Disclaimer: This article is for informational purposes only and does not constitute financial advice. Always consult with a financial advisor before making investment decisions.
Charts