
The Significance of Oil's Rise: Insights for Investors
Introduction
The recent surge in oil prices, driven by geopolitical tensions such as the Iran crisis, has significant implications for global markets. Understanding these fluctuations is crucial for investors, as oil prices often serve as a barometer for broader economic stability and market sentiment. This article explores the current dynamics of oil prices, their impact on market stability, and how investors can use MarketVibe's metrics, particularly the Crash Warning Index (CWI), to navigate these changes effectively.
Current Market Dynamics
Oil prices have been on a volatile path, influenced by geopolitical events and economic policies. The recent tensions in the Middle East, particularly involving Iran, have led to a spike in oil prices. Additionally, discussions around releasing oil reserves to stabilize prices have added another layer of complexity. These fluctuations can affect everything from inflation rates to consumer spending, making them critical for investors to monitor.
CW Index Insights
The Crash Warning Index (CWI) is a composite indicator that aggregates several risk dimensions, including market breadth, volatility, and defensive behavior. Currently, the CWI stands at 7.9, indicating elevated risk levels. This index is particularly sensitive to oil price movements, as they can signal shifts in economic stability and investor sentiment.
How the CWI Works
The CWI is constructed by combining various market indicators:
- Breadth: Measures the proportion of stocks participating in a market move. A narrow breadth often precedes market corrections.
- Volatility: Assessed through metrics like ATR% (Average True Range as a percentage of price), indicating market stability.
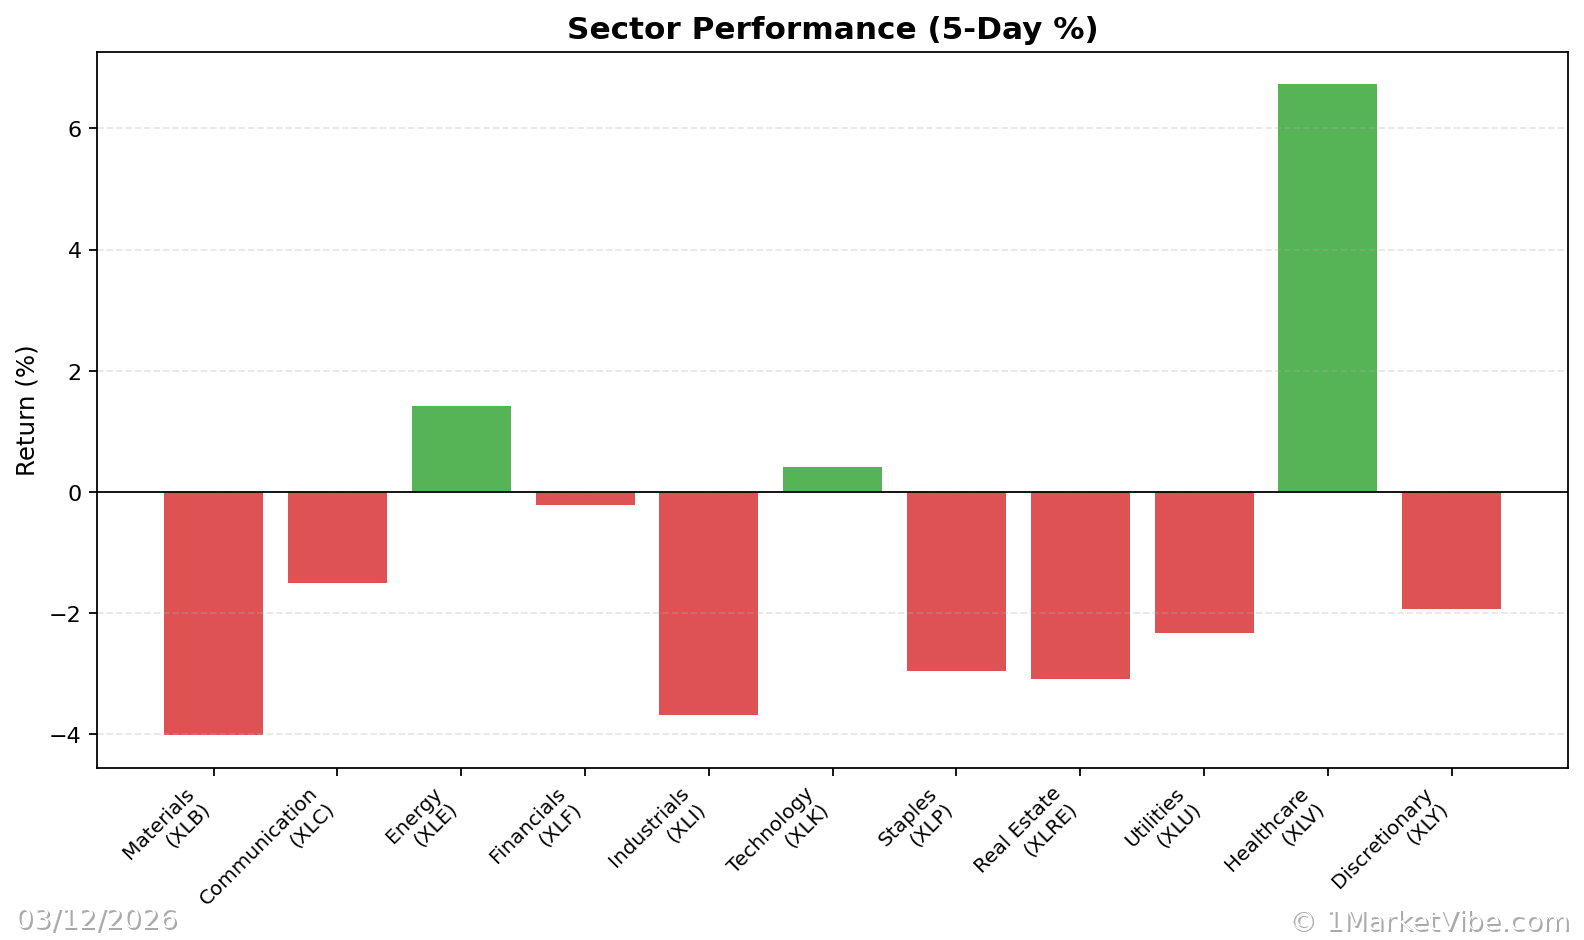
- Defensive Behavior: Observed through sector rotations into traditionally safer areas like utilities and consumer staples.
Day-to-day changes in the CWI are influenced by these components, with oil price volatility being a significant factor due to its impact on economic forecasts and investor confidence.
Interpretation of CWI Levels
- CWI below 3: Generally indicates a stable market environment with low risk.
- CWI between 3 and 6: Suggests caution, as risk levels are rising.
- CWI above 6: Signals heightened risk, with potential for market corrections. The current reading of 7.9 suggests that investors should be particularly vigilant.
Real-World Scenarios
Scenario 1: Rising Oil Prices and Market Volatility
Imagine a scenario where oil prices surge due to geopolitical tensions. The CWI rises above 6, indicating increased market risk. Investors might feel tempted to sell off positions in panic. However, a more informed approach would involve reassessing portfolio risk, possibly reducing exposure to high-volatility sectors, and considering defensive strategies.
Scenario 2: Stabilizing Oil Prices and Market Recovery
In a situation where oil prices stabilize after a reserve release, the CWI might drop below 6, suggesting reduced risk. This could be an opportunity for investors to cautiously increase exposure, particularly in sectors poised to benefit from lower energy costs.
Scenario 3: Persistent High Oil Prices
If oil prices remain high, maintaining a CWI above 7, it indicates sustained risk. Investors should focus on defensive sectors and consider hedging strategies to protect against potential downturns.
How to Use This Insight in a Process
- Monitor CWI Levels: Use the CWI as a guide for adjusting risk exposure. High CWI levels suggest a defensive posture, while lower levels may allow for more aggressive risk-taking.
- Incorporate Breadth and Volatility Metrics: Complement the CWI with other MarketVibe metrics like % Above 50-DMA and ATR% to get a fuller picture of market conditions.
- Utilize the Decision Edge Dashboard: This tool provides a comprehensive view of market risk and can help confirm insights from the CWI and other indicators.
Common Misuses & Misconceptions
- Treating CWI as a Stand-Alone Signal: The CWI should be part of a broader analysis, not a sole decision-making tool.
- Ignoring Sector Context: Different sectors react differently to oil price changes. Consider sector-specific impacts.
- Overreacting to Daily Changes: Focus on trends rather than daily fluctuations to avoid unnecessary trading.
To see these breadth and risk metrics in one place each day, you can use the Decision Edge dashboard at 1marketvibe.com.
Disclaimer: This article is for informational purposes only and does not constitute financial advice. Please consult with a financial advisor before making investment decisions.