
Iran Conflict Resolution Indicates Stability in Oil Markets
- Authors

- Name
- MarketVibe Team
- @1marketvibe
Iran Conflict Resolution Indicates Stability in Oil Markets
Orientation – What Are We Explaining?
In this article, we explore the potential stabilization of oil markets following signals of a resolution to the Iran conflict. This geopolitical development is significant for traders as it influences global economic stability and market dynamics. Understanding how such events interact with MarketVibe's metrics—like the Crash Warning Index (CWI)—can inform better decision-making processes. These metrics help traders assess risk levels, adjust exposure, and anticipate market shifts without relying on speculative predictions.
How It Works – Mechanics & Data
The Crash Warning Index (CWI) is a composite indicator that aggregates various risk dimensions, including market breadth, volatility, and defensive behavior. It provides traders with an early warning signal of potential market corrections. A CWI reading above 6 suggests elevated risk, while readings below 3 indicate a more stable environment.
- Market Breadth: This measures the percentage of stocks trading above their 50-day moving average (50-DMA). A higher percentage indicates a healthy trend, whereas a lower percentage suggests weakening momentum.
- Volatility (ATR%): The Average True Range (ATR) as a percentage of price measures market volatility. Higher ATR% values indicate more volatile conditions.
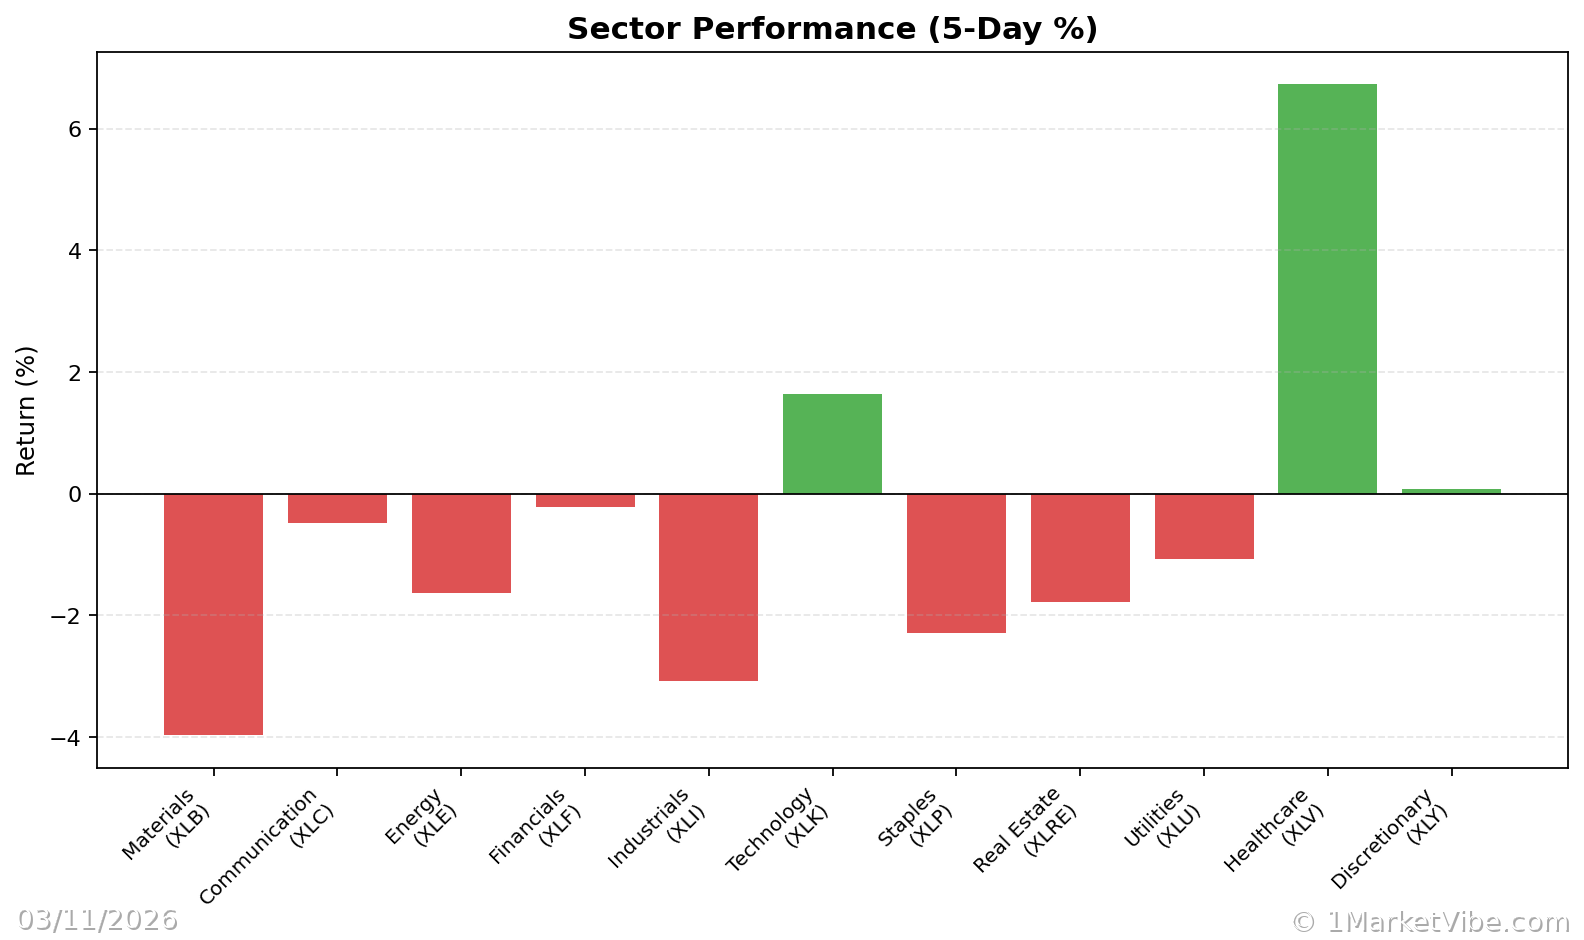
- Defensive Behavior: Observing sector performance, such as utilities or consumer staples, can indicate a shift towards defensive positioning in riskier climates.
Day-to-day movements in these metrics are influenced by market sentiment, geopolitical events, and economic data releases. For instance, news of a conflict resolution can reduce perceived risk, leading to a drop in the CWI and increased market stability.
Interpretation – What Different Levels Tend to Mean
CWI Levels:
- Above 6: Elevated risk, potential for market corrections.
- 3 to 6: Moderate risk, cautious optimism.
- Below 3: Low risk, conducive to risk-taking.
Breadth and Volatility Combinations:
- Strong Breadth + Low Volatility: Indicates a stable, trending market.
- Weak Breadth + Rising Volatility: Suggests market instability and potential corrections.
- Defensive Sectors Leading: Often seen when CWI is high, indicating a risk-averse environment.
Real-World Scenarios – How This Shows Up in Markets
Topping Environment: As the market indices climb, the percentage of stocks above their 50-DMA declines, signaling weakening breadth. Traders might feel tempted to chase the rally, but a high CWI suggests caution.
Bull Leg Surge: Following positive geopolitical news, such as the Iran conflict resolution, the % Above 50-DMA surges, indicating renewed market strength. Traders might increase exposure, but should remain vigilant of volatility spikes.
Volatility Spike: A sudden geopolitical event causes ATR% to jump, with CWI accelerating. Traders may panic and sell, but a more informed approach would involve reassessing risk exposure and considering hedging strategies.
How to Use This Insight in a Process
- Risk Management: When CWI is high and breadth is weak, prioritize defensive strategies and reduce new risk exposure.
- Opportunity Identification: In environments where breadth and leadership are strong, consider increasing exposure, provided setups align with your strategy.
- Regime Assessment: Use the Market Dashboard to label the current market regime, then confirm with internal metrics like breadth and volatility.
Common Misuses & Misconceptions
Stand-Alone Signal: Treating CWI or any single metric as a definitive entry signal can lead to missteps. Instead, use it as part of a broader risk assessment framework.
Ignoring Context: Failing to consider sector rotation or the broader economic environment can skew interpretations. Always contextualize metrics within the current market landscape.
- Overreacting to One-Day Changes: Metrics can fluctuate daily; focus on trends and sustained levels rather than reacting to short-term noise.
To see these breadth and risk metrics in one place each day, you can use the Decision Edge dashboard at 1marketvibe.com.
DISCLAIMER: This article is for informational purposes only and should not be considered financial advice. Always conduct your own research or consult with a financial advisor before making investment decisions.