The Implications of Gold's $5,000 Surge for Market Safe Havens
- Authors

- Name
- MarketVibe Team
- @1marketvibe
The Implications of Gold's $5,000 Surge for Market Safe Havens
Gold's recent surge past $5,000 per ounce has captured the attention of investors worldwide. This development is not just a headline-grabbing event but a significant indicator of shifting market dynamics, particularly in the context of safe-haven assets. In this article, we'll explore the implications of this price movement, how it relates to MarketVibe's metrics like the Crash Warning Index (CWI), and what it means for traders looking to navigate these turbulent times.
Understanding the Market Context
Why Gold Matters
Gold has long been considered a safe-haven asset, a refuge for investors during times of market uncertainty. Its recent price surge suggests a shift in investor sentiment, moving away from riskier assets like technology stocks towards more stable, defensive investments. This shift is crucial for traders to understand as it can inform decisions about portfolio allocation and risk management.
The Role of MarketVibe Metrics
MarketVibe's Decision Edge Dashboard provides a comprehensive view of market risk through various metrics, including the Crash Warning Index (CWI). The CWI is a composite measure that incorporates breadth, volatility, and defensive behavior to gauge market risk. Currently, the CWI sits at 5.4, indicating a stable yet cautious market environment. This reading suggests that while the market is not in immediate danger, there is an underlying caution that traders should heed.
How the Crash Warning Index Works
Mechanics of the CWI
The CWI is constructed by analyzing several dimensions of market health:
- Breadth: Measures the number of stocks participating in market movements. A broad participation indicates a healthy market.
- Volatility: Assessed through metrics like ATR% (Average True Range as a percentage of price), which indicates the level of price fluctuations.
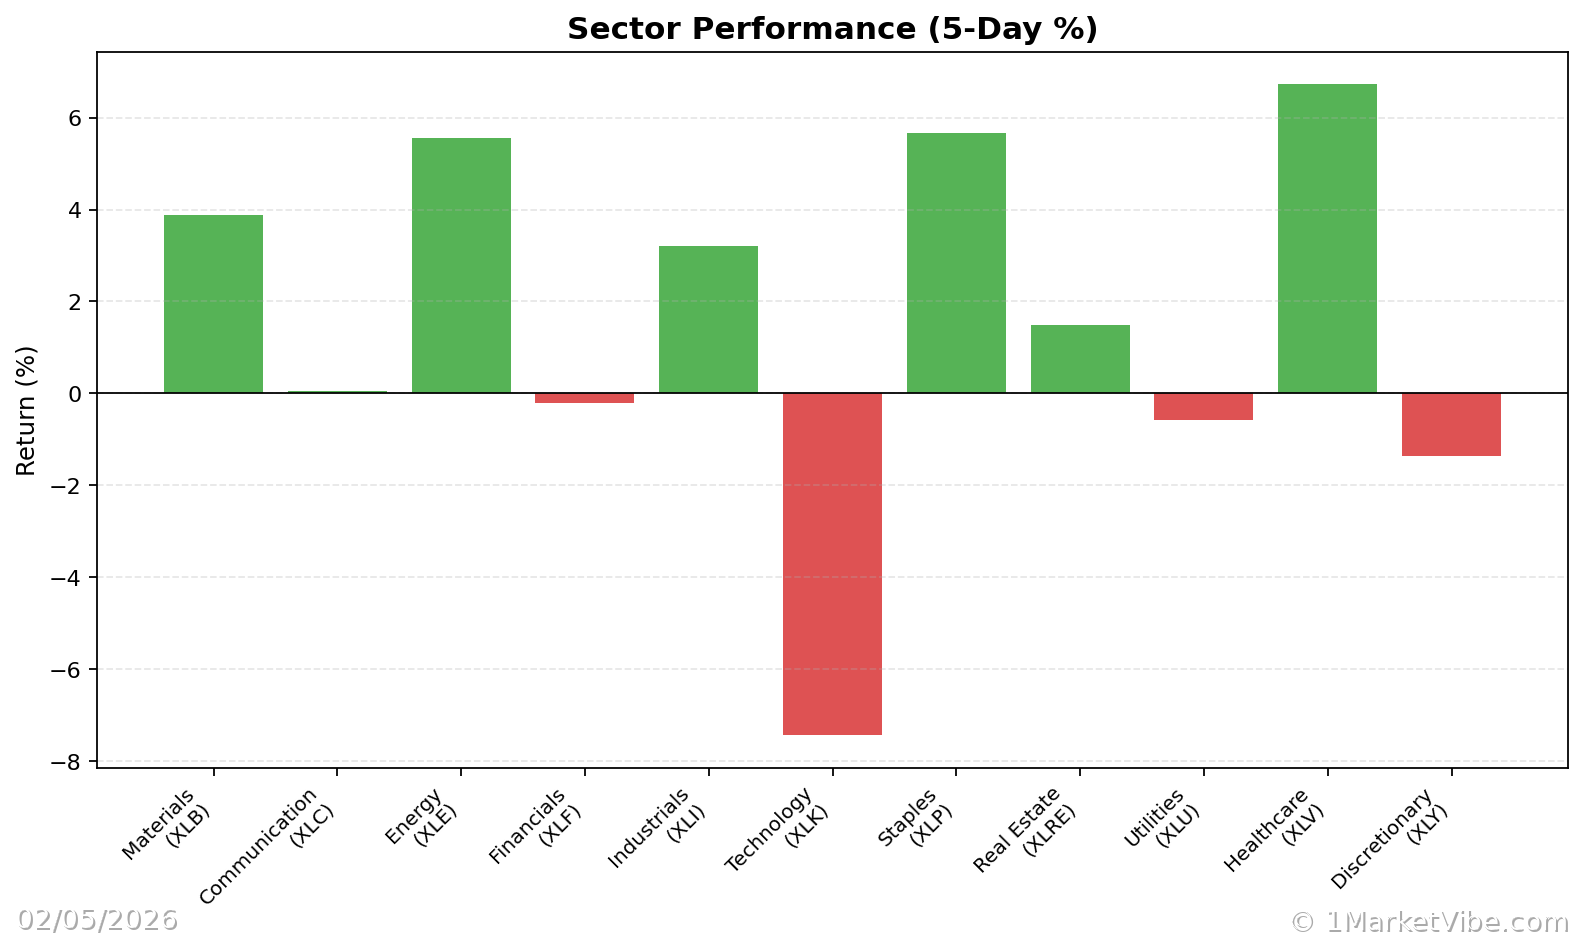
- Defensive Behavior: Observed through the performance of defensive sectors like consumer staples and utilities.
The CWI aggregates these factors to provide a single, easy-to-understand measure of market risk. Daily movements in the CWI are driven by changes in these underlying components, such as a sudden increase in volatility or a shift in sector performance.
Interpretation of CWI Levels
- Below 3: Low risk, typically a stable market environment.
- 3 to 6: Moderate risk, where caution is advised.
- Above 6: High risk, often preceding market corrections.
In the current scenario, with the CWI at 5.4, the market is in a moderate risk zone. This level suggests that while the market is not in immediate peril, traders should be prepared for potential volatility.
Real-World Scenarios
Scenario 1: A Topping Market
Imagine a scenario where the broader market indices continue to rise, but the % Above 50-DMA metric shows declining breadth. This divergence often signals a topping market, where fewer stocks are driving the indices higher. In such cases, the CWI might rise as volatility increases and defensive sectors begin to outperform.
Trader's Temptation: To chase the rising indices.
Informed Response: Recognize the warning signs and consider reducing exposure to riskier assets.
Scenario 2: A New Bull Leg
Conversely, a scenario where the % Above 50-DMA surges and remains elevated could indicate the start of a new bull market. Here, the CWI might remain low, reflecting broad market participation and low volatility.
Trader's Temptation: To remain overly cautious due to past volatility.
Informed Response: Be open to increasing exposure, provided individual setups align with broader market trends.
Scenario 3: Volatility Spike
A sudden spike in ATR% could signal increased market volatility, often accompanied by a rising CWI. This environment might see gold and other safe-haven assets outperforming as investors seek stability.
Trader's Temptation: To panic and make hasty decisions.
Informed Response: Use the CWI and other metrics to assess whether the volatility is a temporary spike or a sign of deeper market issues.
Incorporating Insights into Your Process
Practical Guidelines
- When Breadth is Weak and CWI is High: Emphasize defensive strategies and reduce new risk exposure.
- When Breadth and Leadership Broaden: Consider adding exposure, but ensure setups are robust.
- Use the Market Dashboard: As a high-level regime label, then confirm with internal metrics.
Common Misuses & Misconceptions
- Treating CWI as a Stand-Alone Signal: The CWI should guide risk posture, not dictate specific trades.
- Ignoring Context: Always consider sector rotation and broader market trends.
- Overreacting to One-Day Changes: Focus on trends over time rather than daily fluctuations.
To see these breadth and risk metrics in one place each day, you can use the Decision Edge dashboard at 1marketvibe.com.
DISCLAIMER: This article is for informational purposes only and should not be construed as financial advice. Always conduct your own research or consult a financial advisor before making investment decisions.
Charts