
Tech Selloff Indicates Market Shift as CW Index Reaches 5.9
- Authors

- Name
- MarketVibe Team
- @1marketvibe
Tech Selloff Indicates Market Shift as CW Index Reaches 5.9
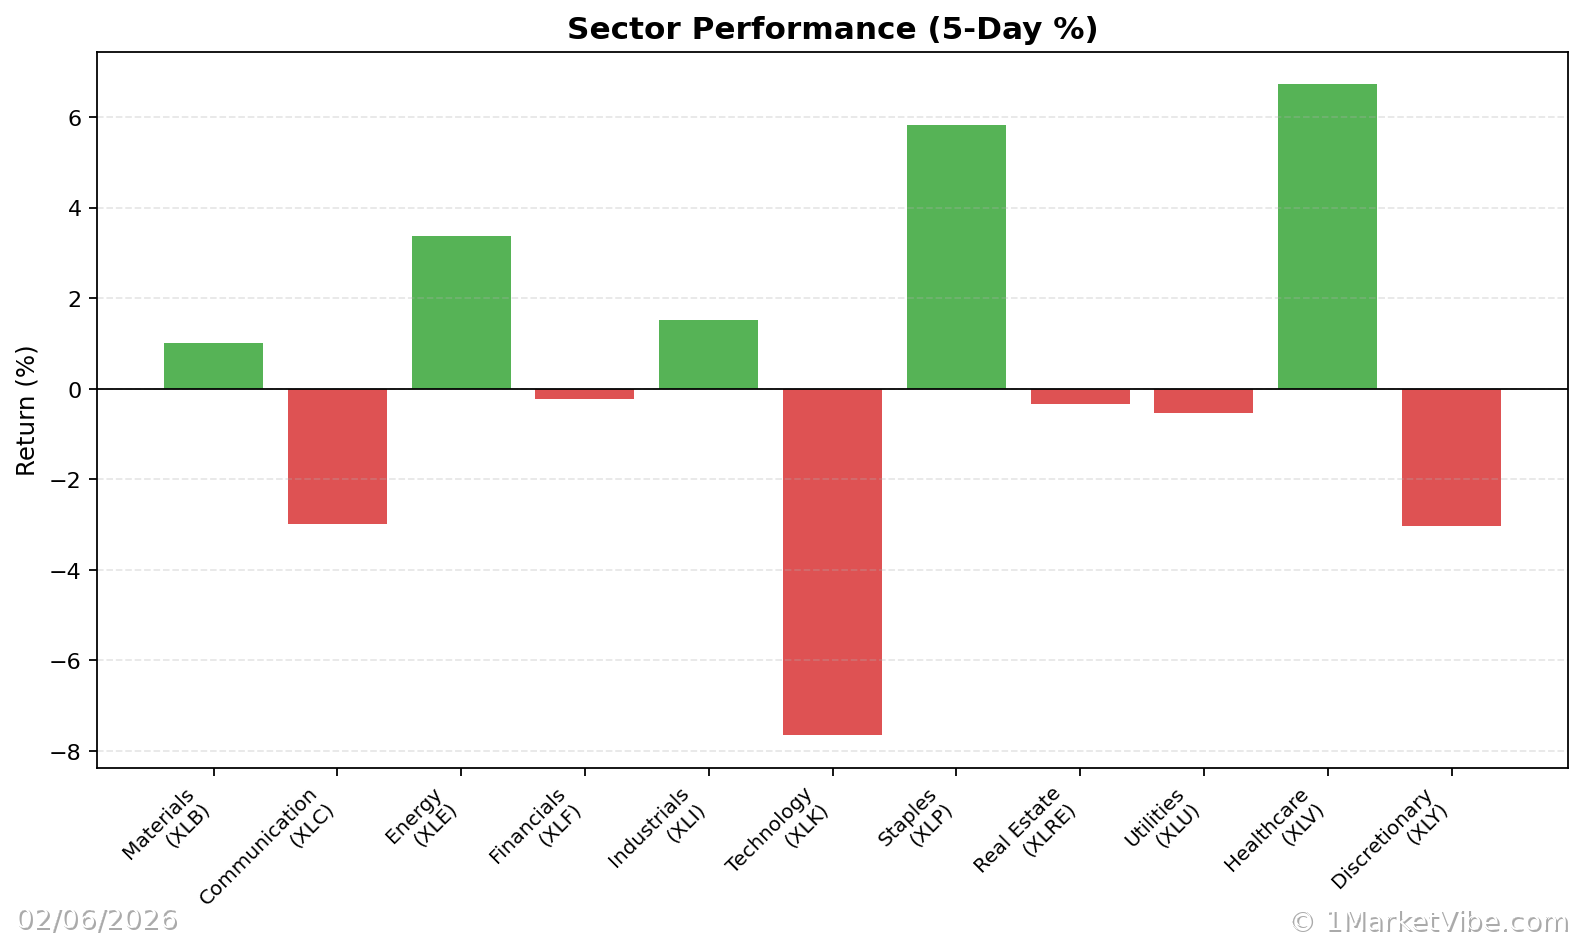
The recent selloff in technology stocks has captured the attention of traders and investors worldwide, signaling potential shifts in market dynamics. This movement is underscored by the Crash Warning Index (CWI), which has reached a level of 5.9. Understanding the implications of this metric can provide valuable insights into market risk and help traders make informed decisions.
Orientation – What Are We Explaining?
Crash Warning Index (CWI) is the focal point of our discussion. This composite metric is designed to gauge the overall risk environment in the market by integrating several dimensions, including breadth, volatility, and defensive behavior. Traders should care about the CWI because it can inform decisions about risk exposure, highlight potential blind spots in market analysis, and fit into a structured trading process by acting as a guide rather than a magic signal.
How It Works – Mechanics & Data
The CWI is constructed by aggregating data from multiple market indicators:
- Breadth: Measures the proportion of stocks above their 50-day moving average (50-DMA) and the advance/decline net (A/D Net), which indicates internal market strength.
- Volatility: Assessed through metrics like ATR% (Average True Range as a percentage of price), which captures the market's volatility regime.
- Defensive Behavior: Observes the performance of defensive sectors compared to the broader market.
The CWI moves daily based on changes in these underlying components. For example, if a significant number of stocks fall below their 50-DMA or if volatility spikes, the CWI will likely rise, indicating increased market risk.
Interpretation – What Different Levels Tend to Mean
CWI Ranges and Implications:
- Below 3: Generally indicates a stable market environment with low risk of corrections.
- Between 3 and 6: Suggests caution as risk factors are increasing; traders should be vigilant.
- Above 6: Signals elevated risk, where corrections or significant market shifts become more likely.
Common combinations include scenarios where weak breadth and rising volatility coincide, often leading to defensive sectors taking the lead. This alignment can be seen as a warning sign for traders to reassess their risk exposure.
Real-World Scenarios – How This Shows Up in Markets
Scenario 1: Topping Environment
Imagine a situation where major indices continue to rise, but the percentage of stocks above their 50-DMA begins to decline. This divergence often precedes a market top. Traders might feel tempted to chase the rally, but a more informed view would recognize the weakening breadth as a cautionary signal.
Scenario 2: Bull Leg Initiation
In a new bull market phase, the % Above 50-DMA surges and remains high, indicating strong participation across stocks. Here, the CWI might remain low, reflecting a conducive environment for risk-taking. Traders should be open to adding exposure, provided their setups align.
Scenario 3: Volatility Spike
A sudden increase in ATR% and a concurrent rise in the CWI could indicate a market under stress. During such times, traders might panic and sell indiscriminately. However, understanding the metrics can help them manage positions more strategically, perhaps by hedging or reducing leverage.
How to Use This Insight in a Process
To incorporate the CWI into a trading process:
- When breadth is weak and CWI is high, emphasize defensive strategies and reduce new risk exposure.
- When breadth and leadership broaden, consider increasing exposure, but only if your trading setups are confirmed.
- Use the Market Dashboard as a high-level regime label, then verify with internal metrics like CWI for confirmation.
Common Misuses & Misconceptions
Treating CWI as a Stand-Alone Signal: Traders often misuse the CWI by relying on it for precise entry or exit signals. Instead, it should guide risk posture and expectations.
Ignoring Context: Failing to consider sector rotation or broader market conditions can lead to misinterpretation. Always analyze CWI in conjunction with other indicators.
- Overreacting to One-Day Changes: Day-to-day fluctuations in CWI can be misleading. Focus on trends and sustained levels rather than isolated spikes.
To see these breadth and risk metrics in one place each day, you can use the Decision Edge dashboard at 1marketvibe.com.
Disclaimer: This article is for informational purposes only and does not constitute financial advice. Please consult with a financial advisor before making any investment decisions.