

Tech Stocks Decline as CW Index Reaches 4.9 for Portfolio Insights
- Authors

- Name
- MarketVibe Team
- @1marketvibe
Understanding the Crash Warning Index (CWI) and Its Implications for Tech Stocks
1. Orientation – What Are We Explaining?
Today, we're diving into the Crash Warning Index (CWI), a critical metric for understanding market risk, particularly as it pertains to the recent decline in tech stocks. The CWI is a composite indicator that aggregates several dimensions of market risk, including breadth, volatility, and defensive behavior. Traders should care about the CWI because it helps inform decisions about risk exposure and portfolio adjustments. It reduces blind spots by providing an early warning of potential market corrections, allowing traders to adjust their strategies proactively rather than reactively.
2. How It Works – Mechanics & Data
The Crash Warning Index is constructed by combining multiple market indicators that reflect different aspects of risk:
- Breadth: Measures the proportion of stocks advancing versus declining. A narrow breadth, where fewer stocks are leading the market, can signal underlying weakness.
- Volatility: Assessed through metrics like ATR% (Average True Range as a percentage of price), indicating how much the market is moving relative to its price.
- Defensive Behavior: Observes the performance of defensive sectors (e.g., utilities, consumer staples) relative to the broader market.
The CWI moves based on changes in these underlying components. For instance, if volatility spikes and breadth narrows, the CWI will rise, indicating increased market risk. Conversely, if volatility decreases and breadth improves, the CWI will fall, suggesting a more stable environment.
3. Interpretation – What Different Levels Tend to Mean
The CWI is typically interpreted in ranges:
- Below 3: Indicates a low-risk environment where markets are generally stable.
- 3 to 6: Suggests caution; risk is moderate, and traders should be vigilant.
- Above 6: Signals elevated risk; corrections are more likely, and defensive measures should be considered.
In our current scenario, the CWI is at 4.9, placing it in the moderate risk category. This level suggests that while the market isn't in immediate danger of a crash, caution is warranted, especially in the tech sector, which has recently shown signs of weakness.
4. Real-World Scenarios – How This Shows Up in Markets
Scenario 1: Topping Environment
Imagine a market where major indices like the S&P 500 continue to rise, but the number of stocks making new highs is decreasing. Here, the CWI might rise as breadth deteriorates, even though the index itself appears strong. Traders might be tempted to buy into the rally, but a more informed view would recognize the underlying weakness and proceed with caution.
Scenario 2: Volatility Spike
Consider a situation where geopolitical tensions cause a sudden increase in market volatility. The ATR% would rise, pushing the CWI higher. Traders might feel the urge to sell in panic, but understanding the CWI can help them recognize this as a temporary spike, prompting them to evaluate their positions more calmly.
Scenario 3: Tech Sector Decline
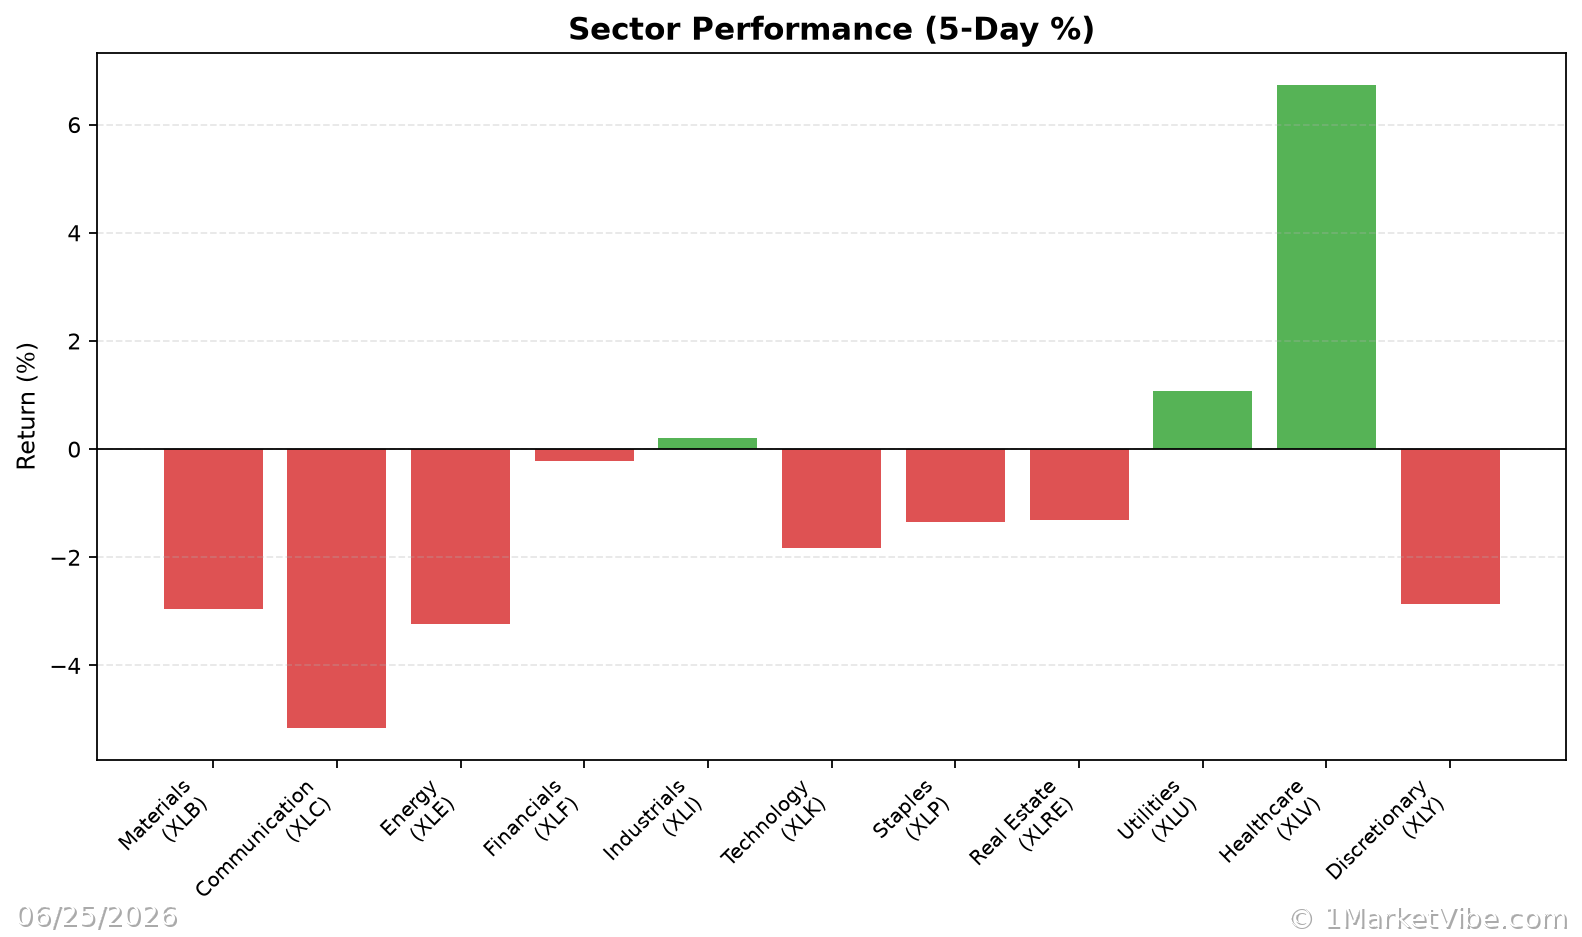
In the current market, tech stocks have declined, contributing to the CWI's rise to 4.9. This situation might tempt traders to exit tech positions entirely. However, a nuanced approach would involve assessing whether this decline is a temporary correction or part of a broader trend, using the CWI as a guide to adjust risk exposure appropriately.
5. How to Use This Insight in a Process
- Emphasize Defense: When the CWI is high, focus on defensive strategies. This might mean reducing exposure to high-risk sectors like tech and increasing allocations to more stable sectors.
- Monitor Breadth and Volatility: Use the Market Dashboard to keep an eye on breadth and volatility metrics. If both are weak, it may be wise to hold off on new risk-taking.
- Adjust Position Sizing: Based on CWI levels, adjust your position sizes to manage risk. A higher CWI suggests smaller positions to mitigate potential losses.
6. Common Misuses & Misconceptions
- Not a Stand-Alone Signal: Some traders mistakenly use the CWI as a direct buy or sell signal. Instead, it should guide overall risk posture.
- Ignoring Context: Focusing solely on the CWI without considering sector rotation or broader market trends can lead to poor decisions.
- Overreacting to Daily Changes: The CWI can fluctuate daily; it's important to look at trends over time rather than reacting to every small move.
To see these breadth and risk metrics in one place each day, you can use the Decision Edge dashboard at 1marketvibe.com.
Disclaimer: This article is for informational purposes only and does not constitute financial advice. Please consult with a financial advisor before making any investment decisions.