

Tech Selloff Highlights Market Risks Revealed by CW Index
- Authors

- Name
- MarketVibe Team
- @1marketvibe
Tech Selloff Highlights Market Risks Revealed by CW Index
The recent selloff in technology stocks has sent ripples across global markets, raising concerns about broader market risks. At the heart of these concerns is the Crash Warning Index (CWI), a key metric from MarketVibe that helps traders assess the underlying risk environment. Understanding the CWI and its implications can provide valuable insights into market dynamics and guide traders in making informed decisions.
What is the Crash Warning Index (CWI)?
The Crash Warning Index (CWI) is a composite indicator designed to capture various dimensions of market risk. It aggregates data on market breadth, volatility, and defensive behavior to provide a comprehensive view of the market's risk landscape. Traders should care about the CWI because it helps identify periods of elevated risk, allowing them to adjust their strategies accordingly. Rather than serving as a magic signal, the CWI is a tool for reducing blind spots and enhancing a structured trading process.
How the CWI Works
The CWI is constructed by combining several market indicators:
- Breadth: Measures the number of stocks participating in a market move. A decline in breadth, where fewer stocks are above their 50-day moving average, can signal weakening market strength.
- Volatility: Assessed through metrics like the Average True Range (ATR%), which indicates how much a market's price is moving relative to its price level.
- Defensive Behavior: Observes shifts in sector leadership, particularly when defensive sectors like utilities and consumer staples outperform.
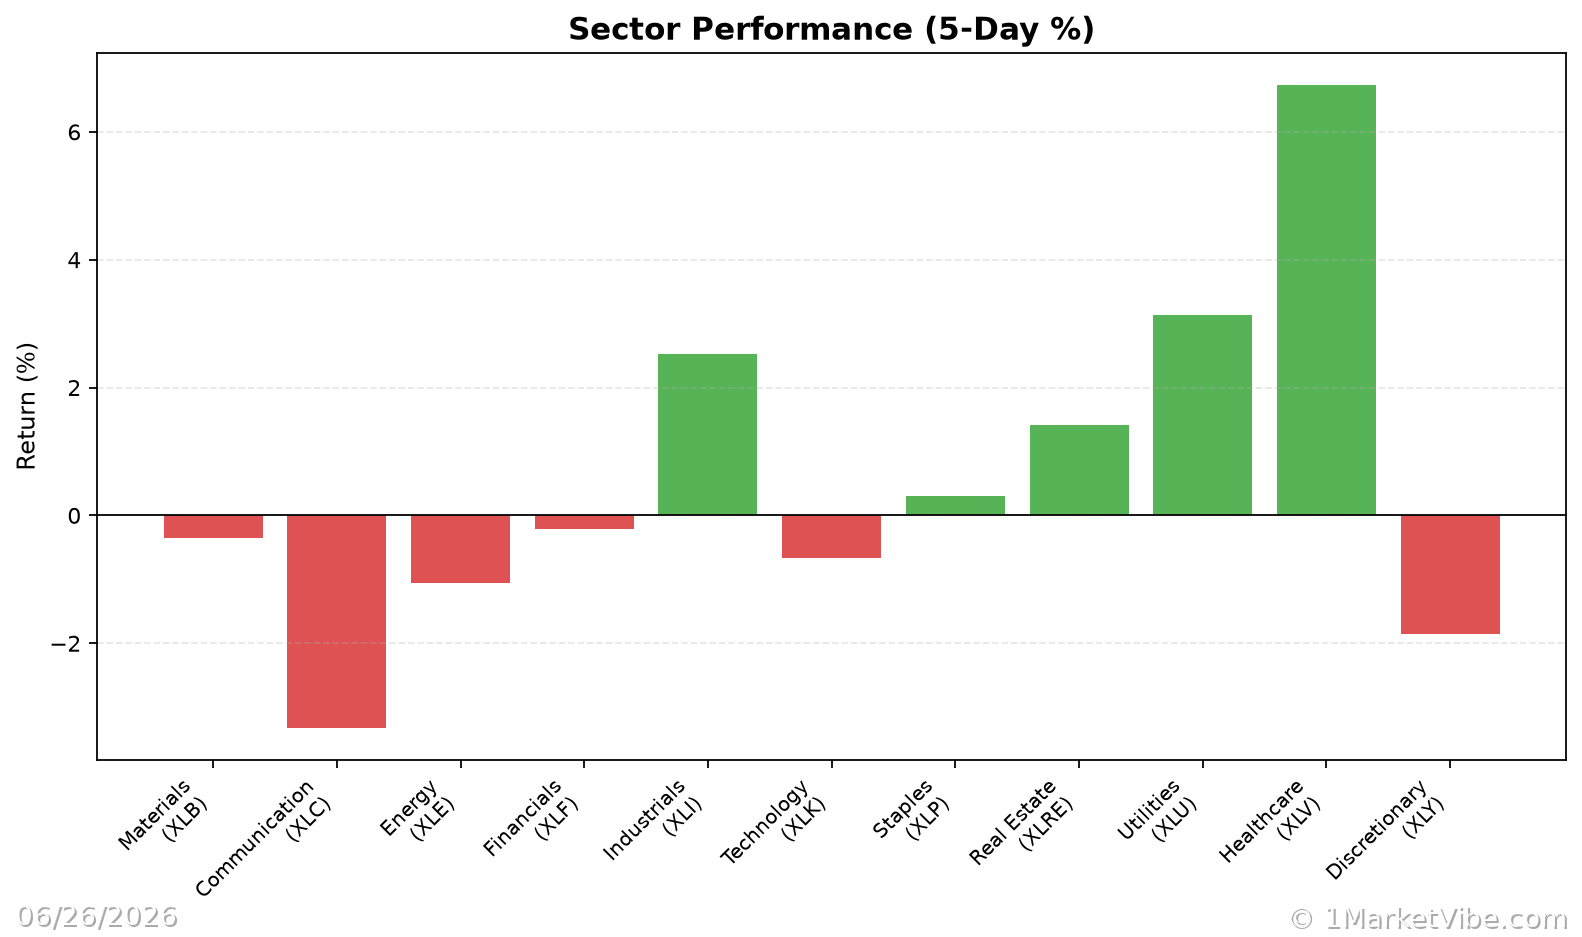
The CWI moves based on changes in these underlying components. For example, a rise in volatility or a contraction in breadth can push the CWI higher, indicating increased market risk.
Interpreting the CWI
The CWI is typically interpreted in ranges:
- Below 3: Generally suggests a stable market environment with lower risk.
- Between 3 and 6: Indicates moderate risk, where caution is advised.
- Above 6: Signals elevated risk, where corrections or increased volatility are more likely.
Common combinations of market conditions include:
- Strong Breadth + Low Volatility: Often seen in stable, trending markets.
- Weak Breadth + Rising Volatility: Can indicate a market under stress, as seen in the recent tech selloff.
- Defensive Sectors Leading: Suggests a shift towards risk aversion among investors.
Real-World Scenarios
Scenario 1: Topping Environment
Imagine a scenario where major indices continue to rise, but fewer stocks are participating in the rally. The % Above 50-DMA declines, and the CWI begins to climb above 6. Traders might be tempted to chase the rally, but a more informed view would recognize the risk of a potential correction and adopt a defensive posture.
Scenario 2: Bull Market Leg
In a strong bull market, the % Above 50-DMA surges, indicating broad participation. The CWI remains below 3, suggesting a low-risk environment. Traders can consider increasing exposure, provided their setups align with the broader market trend.
Scenario 3: Volatility Spike
Suppose a geopolitical event causes a sudden spike in volatility, reflected in a rising ATR%. The CWI jumps to 5.5, signaling heightened risk. While some traders might panic, those using the CWI can adjust their risk exposure and consider hedging strategies to protect their portfolios.
Incorporating CWI into a Trading Process
To effectively use the CWI, traders should:
- Emphasize Defense When Risk is High: When the CWI is above 6, focus on preserving capital and reducing new risk exposure.
- Be Open to Opportunities When Risk is Low: A low CWI allows for more aggressive positioning, but only if market conditions and individual setups are favorable.
- Use the Market Dashboard for Context: The Decision Edge dashboard provides a high-level view of market regimes, helping traders confirm their interpretations of the CWI.
Common Misuses and Misconceptions
Traders often misuse the CWI by:
- Treating it as a Stand-Alone Signal: The CWI should be part of a broader analysis, not a sole decision-maker.
- Ignoring Context: Failing to consider sector rotation or time frame can lead to misinterpretation.
- Overreacting to Daily Changes: The CWI is more meaningful over several days rather than reacting to single-day movements.
A healthier approach involves integrating the CWI with other indicators and maintaining a balanced perspective on market conditions.
To see these breadth and risk metrics in one place each day, you can use the Decision Edge dashboard at 1marketvibe.com.
This article is for informational purposes only and does not constitute financial advice. Always consult with a financial advisor before making investment decisions.