


Dow and Nasdaq Decline: Insights on the US-Iran Impact
In the ever-evolving landscape of global finance, geopolitical tensions often play a significant role in shaping market dynamics. Recent developments between the United States and Iran have sent ripples through the financial markets, notably impacting major indices like the Dow Jones Industrial Average and the Nasdaq Composite. Understanding how these geopolitical events influence market behavior is crucial for traders aiming to navigate uncertain waters effectively.
Orientation – What Are We Explaining?
In this article, we'll explore how the current US-Iran tensions are affecting market indices, using MarketVibe's Crash Warning Index (CWI) as our primary lens. The CWI is a composite metric designed to provide early warnings about potential market corrections by analyzing several risk dimensions, including breadth, volatility, and defensive behavior. Traders should care about the CWI because it helps inform risk management decisions, reduces blind spots related to market sentiment, and fits into a structured trading process by offering a high-level view of market risk conditions.
How It Works – Mechanics & Data
The Crash Warning Index (CWI) is constructed by aggregating data from various market indicators:
- Breadth: Measures the percentage of stocks above their 50-day moving average, indicating the overall health of market trends.
- Volatility: Assessed through metrics like the Average True Range Percentage (ATR%), which measures price volatility relative to the asset's price.
- Defensive Behavior: Evaluates the performance of defensive sectors compared to more aggressive ones.
The CWI moves based on changes in these underlying components. For instance, a significant drop in the percentage of stocks above their 50-day moving average, coupled with rising volatility, would likely increase the CWI, signaling elevated market risk.
Interpretation – What Different Levels Tend to Mean
CWI Ranges and Implications:
- Below 3: Market conditions are generally stable, with low risk of correction.
- 3 to 6: Indicates caution; potential for increased volatility and minor corrections.
- Above 6: Suggests heightened risk of significant market corrections.
Common Combinations:
- Strong Breadth + Low Volatility: Typically seen in stable, trending markets.
- Weak Breadth + Rising Volatility: Often precedes market corrections or increased risk periods.
- Defensive Sectors Leading: Suggests a shift towards risk aversion, often seen when CWI is high.
Real-World Scenarios – How This Shows Up in Markets
Scenario 1: Topping Environment
Imagine a scenario where the market indices are grinding higher, but the breadth deteriorates. The percentage of stocks above their 50-day moving average falls below 40%, while the CWI rises above 5. Traders might feel tempted to continue buying into the rally, but a more informed view would suggest caution, as the underlying market health is weakening.
Scenario 2: Bull Leg Surge
In a strong new bull leg, the % Above 50-DMA surges to 70% and stays elevated, while the CWI remains below 3. This indicates robust market health and low risk, encouraging traders to add exposure, provided their setups align with this trend.
Scenario 3: Volatility Spike
A geopolitical event, such as the US-Iran tensions, could cause a volatility spike, with ATR% jumping sharply. If the CWI also accelerates past 6, it signals a high-risk environment. Traders might be tempted to panic sell, but a more informed approach would involve reassessing risk exposure and possibly hedging positions.
How to Use This Insight in a Process
- Emphasize Defense: When breadth is weak and CWI is high, focus on defensive strategies and reduce new risk exposure.
- Add Exposure Cautiously: When breadth and leadership broaden, consider increasing exposure, but only if your trading setups are favorable.
- Regime Confirmation: Use the Market Dashboard to label the current market regime, then confirm with internal metrics like breadth and volatility.
Common Misuses & Misconceptions
Treating CWI as a Stand-Alone Signal: The CWI should not be used in isolation for entry or exit decisions. Instead, integrate it with other indicators and market context.
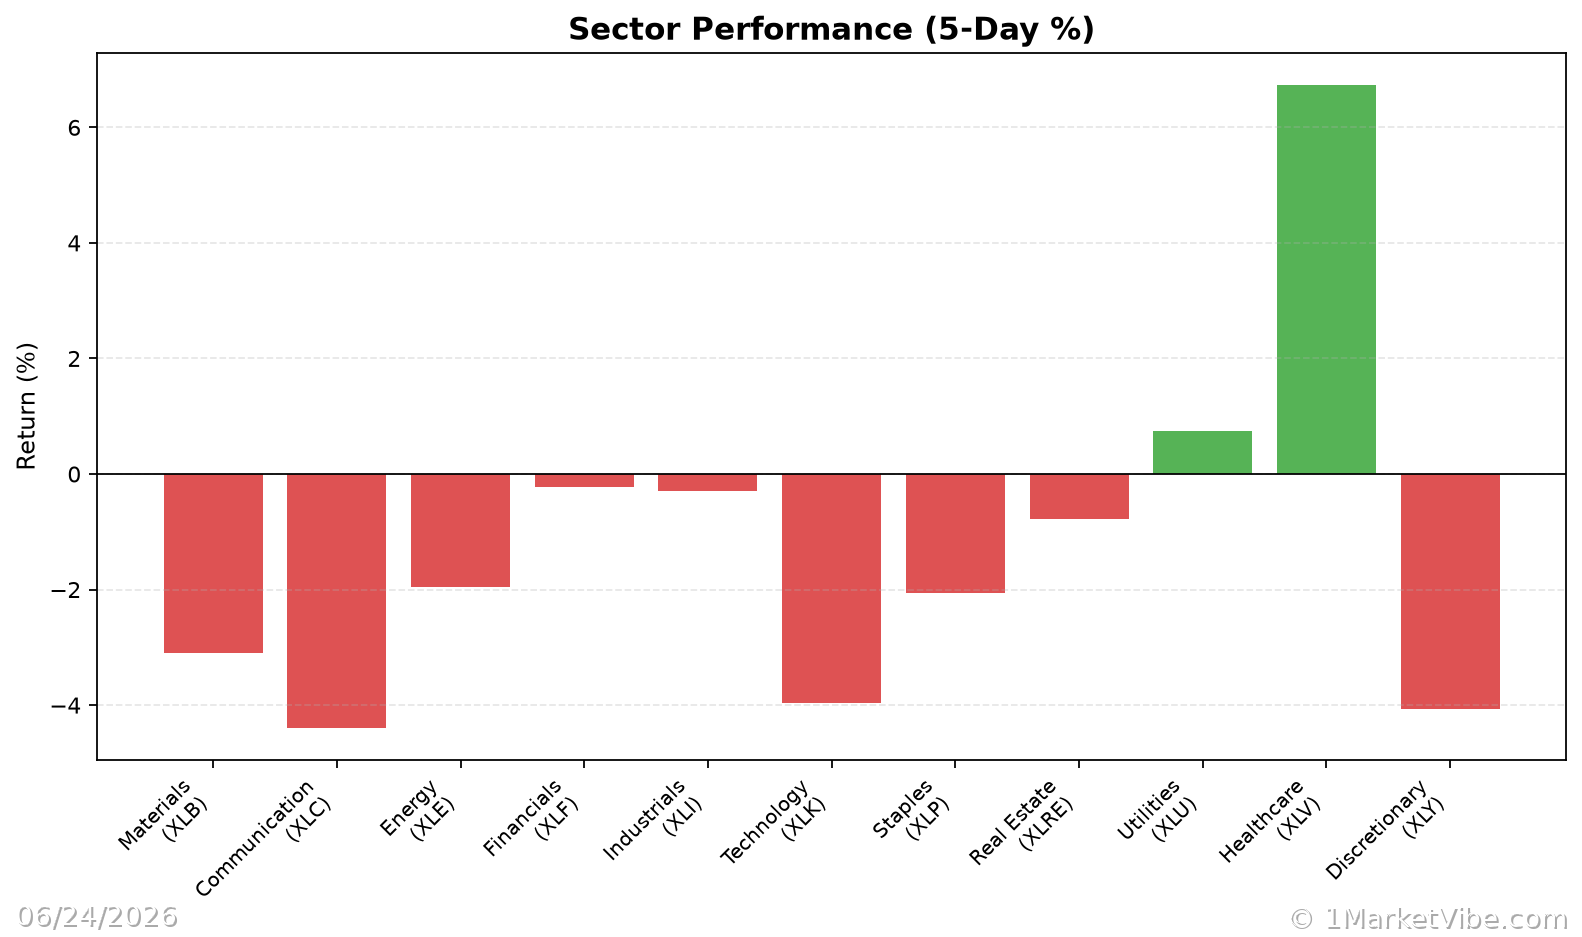
Ignoring Sector Rotation: Focusing solely on the CWI without considering sector performance can lead to missed opportunities or increased risk.
Overreacting to One-Day Changes: Day-to-day fluctuations in the CWI can be misleading. Look for sustained trends or changes in the index.
To see these breadth and risk metrics in one place each day, you can use the Decision Edge dashboard at 1marketvibe.com.
Disclaimer: The information provided in this article is for educational purposes only and should not be considered as investment advice. Please consult with a financial advisor before making any investment decisions.