

SpaceX IPO Sees 18% Drop, Raising Investor Concerns Amid Market Shifts
- Authors

- Name
- MarketVibe Team
- @1marketvibe
Understanding Market Shifts: The Case of SpaceX's IPO Drop
The recent 18% drop in SpaceX's stock price following its initial public offering (IPO) has raised concerns among investors. This event provides an opportunity to explore how market dynamics, as captured by MarketVibe's metrics, can inform investor decisions and risk management strategies. By examining key indicators such as breadth, volatility, and leadership, traders can gain insights into the underlying market conditions that may have contributed to this shift.
MarketVibe Metrics: A Lens on Market Dynamics
Crash Warning Index (CWI)
What It Is: The Crash Warning Index (CWI) is a composite metric that evaluates market risk by considering several dimensions, including breadth, volatility, and defensive behavior. It helps traders assess the likelihood of market corrections.
Why It Matters: A high CWI suggests elevated risk, prompting traders to adopt a more defensive posture. Conversely, a low CWI indicates a stable market environment, allowing for more aggressive risk-taking.
How It Works: The CWI aggregates data from various indicators, such as the percentage of stocks above their 50-day moving average (% Above 50-DMA) and the Average True Range percentage (ATR%), to provide a comprehensive risk assessment.
% Above 50-DMA
What It Is: This metric measures the proportion of stocks trading above their 50-day moving average, offering insights into market breadth and trend health.
Why It Matters: A high percentage indicates strong market breadth, suggesting a healthy uptrend. A low percentage signals weak breadth, often preceding market downturns.
How It Works: By tracking the number of stocks above their 50-DMA, traders can gauge the overall strength or weakness of the market. Daily fluctuations in this metric reflect changes in market sentiment and momentum.
ATR% (Average True Range Percentage)
What It Is: ATR% is a volatility measure that compares the average true range of a stock or index to its price, indicating the level of market volatility.
Why It Matters: High ATR% values suggest increased volatility, often associated with market instability. Low ATR% values indicate a calm, trending market.
How It Works: ATR% is calculated by dividing the average true range by the current price, providing a relative measure of volatility. This metric helps traders anticipate potential price swings and adjust their strategies accordingly.
Interpreting Market Conditions
Breadth and Volatility Interactions
- Strong Breadth + Low Volatility: This combination typically signals a stable, trending market, conducive to risk-taking and portfolio expansion.
- Weak Breadth + Rising Volatility: Indicates a potentially unstable market, warranting caution and defensive strategies.
Market Dashboard Insights
MarketVibe's Decision Edge Dashboard provides a high-level view of market conditions, integrating metrics like CWI, % Above 50-DMA, and ATR% to label the current market climate. This framework helps traders align their strategies with prevailing market regimes.
Real-World Scenarios: Market Dynamics in Action
Scenario 1: A Topping Environment
In a scenario where the market index continues to rise while breadth deteriorates, traders might observe a declining % Above 50-DMA. This divergence often signals a weakening trend, suggesting that the market is topping out. Traders may feel tempted to chase the rally, but a more informed approach would involve reducing exposure and preparing for potential corrections.
Scenario 2: A Bull Market Surge
During a strong bull market, the % Above 50-DMA may surge and remain elevated, indicating robust breadth and trend strength. In such cases, traders can confidently add exposure, provided their setups align with the broader market trend.
Scenario 3: Volatility Spike
A sudden increase in ATR% often accompanies market corrections or heightened uncertainty. In this environment, the CWI may also rise, signaling elevated risk. Traders should focus on risk management, possibly reducing positions or employing hedging strategies to protect against adverse moves.
Incorporating Insights into a Trading Process
Practical Guidelines
- Defensive Posture: When breadth is weak and CWI is high, prioritize defense by reducing new risk and focusing on capital preservation.
- Opportunistic Exposure: When breadth and leadership broaden, consider increasing exposure, but only if setups are favorable.
- Regime Confirmation: Use the Market Dashboard to identify the current market regime, then confirm with internal metrics before making decisions.
Common Misuses and Misconceptions
Misuse 1: Stand-Alone Signals
Traders often misuse metrics like % Above 50-DMA as stand-alone entry signals. Instead, these indicators should guide overall risk posture and complement other analyses.
Misuse 2: Ignoring Context
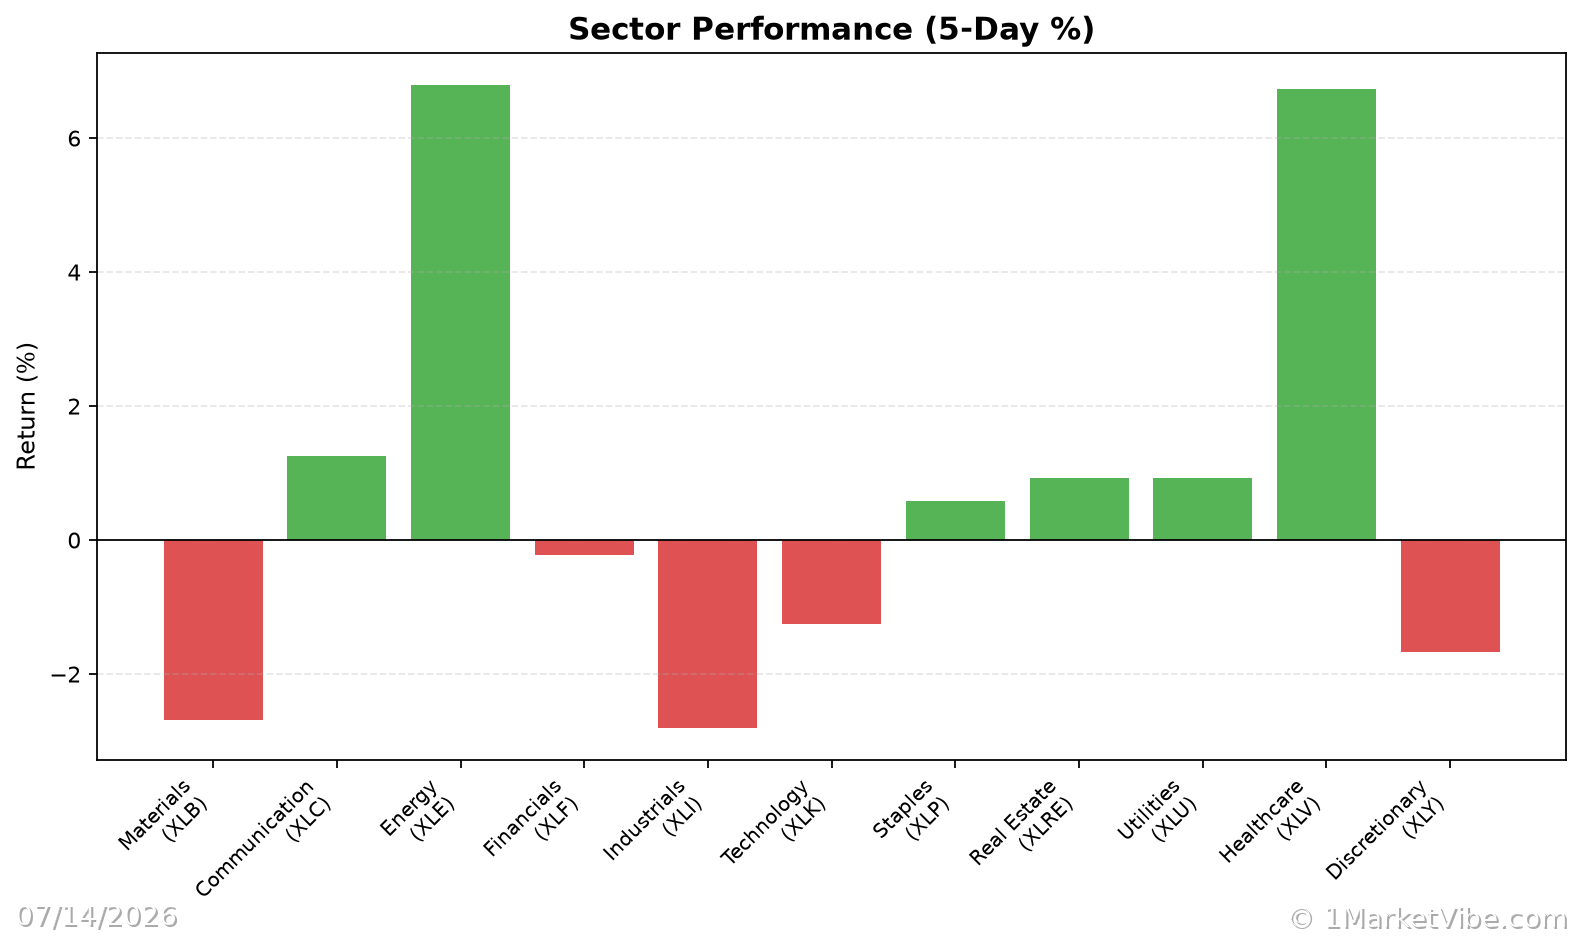
Failing to consider sector rotation or time frames can lead to misinterpretation. Always contextualize metrics within the broader market landscape.
Misuse 3: Overreacting to Daily Changes
Reacting to one-day metric shifts can lead to whipsawing. Focus on trends and sustained changes rather than short-term fluctuations.
To see these breadth and risk metrics in one place each day, you can use the Decision Edge dashboard at 1marketvibe.com.
DISCLAIMER: This article is for informational purposes only and does not constitute financial advice. Market conditions can change rapidly, and past performance is not indicative of future results. Always conduct your own research or consult with a financial advisor before making investment decisions.