

U.S. Strikes Iran and Its Impact on Oil Prices and Market Stability
- Authors

- Name
- MarketVibe Team
- @1marketvibe
Understanding the Impact of U.S. Strikes on Iran on Oil Prices and Market Stability
The recent U.S. military strikes on Iran have sent ripples through global markets, particularly affecting oil prices and raising concerns about market stability. In this article, we will explore how these geopolitical tensions influence market dynamics, focusing on key MarketVibe metrics like the Crash Warning Index (CWI) and the broader implications for traders.
The Importance of Oil Prices in Global Economic Stability
Oil prices play a crucial role in the global economy, influencing everything from transportation costs to the price of goods and services. When geopolitical tensions arise, such as the U.S. strikes on Iran, oil prices can surge, leading to increased inflationary pressures and market volatility. Understanding these dynamics can help traders make informed decisions about risk management and portfolio adjustments.
Current Market Response
Despite the geopolitical tensions, stock futures have remained relatively stable, although oil prices have surged. This stability in stock futures may reflect a cautious optimism among traders, who are weighing the potential economic impacts of rising oil prices against other market factors, such as earnings reports and inflation data.
The Mechanics of Oil Price Surges
Oil prices have spiked following the U.S. strikes on Iran, with U.S. crude and Brent crude futures both seeing significant increases. Historically, geopolitical events in oil-rich regions tend to lead to price volatility as markets react to potential supply disruptions. This time, the situation is compounded by the strategic importance of the Strait of Hormuz, a critical chokepoint for global oil shipments.
Inflation Concerns and Market Implications
Rising oil prices often lead to increased inflation, as higher energy costs trickle down to consumer goods and services. This can put pressure on central banks to adjust monetary policy, potentially leading to interest rate hikes. Traders should be aware of these dynamics, as they can affect everything from bond yields to stock valuations.
Analyzing the Crash Warning Index (CWI)
The Crash Warning Index (CWI) is a composite metric that assesses market risk by analyzing factors such as breadth, volatility, and defensive behavior. As of now, the CWI stands at 4.9, indicating a moderate level of risk. This reading suggests that while the market is not in immediate danger of a crash, traders should remain vigilant, especially given the current geopolitical climate.
How CWI is Constructed
The CWI is built from several components:
- Breadth: Measures the number of stocks participating in a market move.
- Volatility: Assessed through metrics like ATR% (Average True Range as a percentage of price).
- Defensive Behavior: Analyzes the performance of defensive sectors relative to the broader market.
Sector Vulnerabilities
Certain sectors are more vulnerable to rising oil prices and inflation. For example:
- Transportation: Increased fuel costs can squeeze margins.
- Consumer Goods: Higher production and shipping costs can lead to price increases.
- Energy: While oil producers may benefit from higher prices, companies with high energy consumption could face challenges.
Market Stability Risks
The broader implications for market stability include potential increases in volatility and shifts in investor sentiment. As oil prices rise, traders may see increased price swings in financial markets, necessitating a more cautious approach to risk management.
Real-World Scenarios
Scenario 1: Topping Environment
Imagine a scenario where the market index continues to rise, but breadth deteriorates. In this case, the % Above 50-DMA metric might show a declining number of stocks above their 50-day moving average, indicating weakening internal strength. Traders might be tempted to chase the rally, but a more informed view would suggest caution.
Scenario 2: Bull Market Leg
In a strong bull market leg, the % Above 50-DMA could surge and remain elevated, signaling robust participation across stocks. This environment might encourage traders to add exposure, provided their setups align with broader market trends.
Scenario 3: Volatility Spike
A geopolitical event like the U.S. strikes on Iran could lead to a volatility spike, with ATR% increasing sharply. This signals a more unstable market environment, where traders should consider reducing risk and focusing on defensive positions.
Incorporating Insights into a Trading Process
To effectively use these insights:
- Monitor Breadth and CWI: Use these metrics to gauge market health and adjust risk exposure accordingly.
- Emphasize Defense in High-Risk Environments: When CWI is elevated and breadth is weak, prioritize capital preservation.
- Adapt to Changing Conditions: Be flexible in your approach, using the Market Dashboard to stay informed about regime shifts.
Common Misuses and Misconceptions
Traders often misuse these metrics by:
- Treating them as Stand-Alone Signals: It's crucial to consider the broader market context.
- Overreacting to Short-Term Changes: Focus on trends rather than day-to-day fluctuations.
- Ignoring Sector Rotation: Pay attention to leadership changes across sectors.
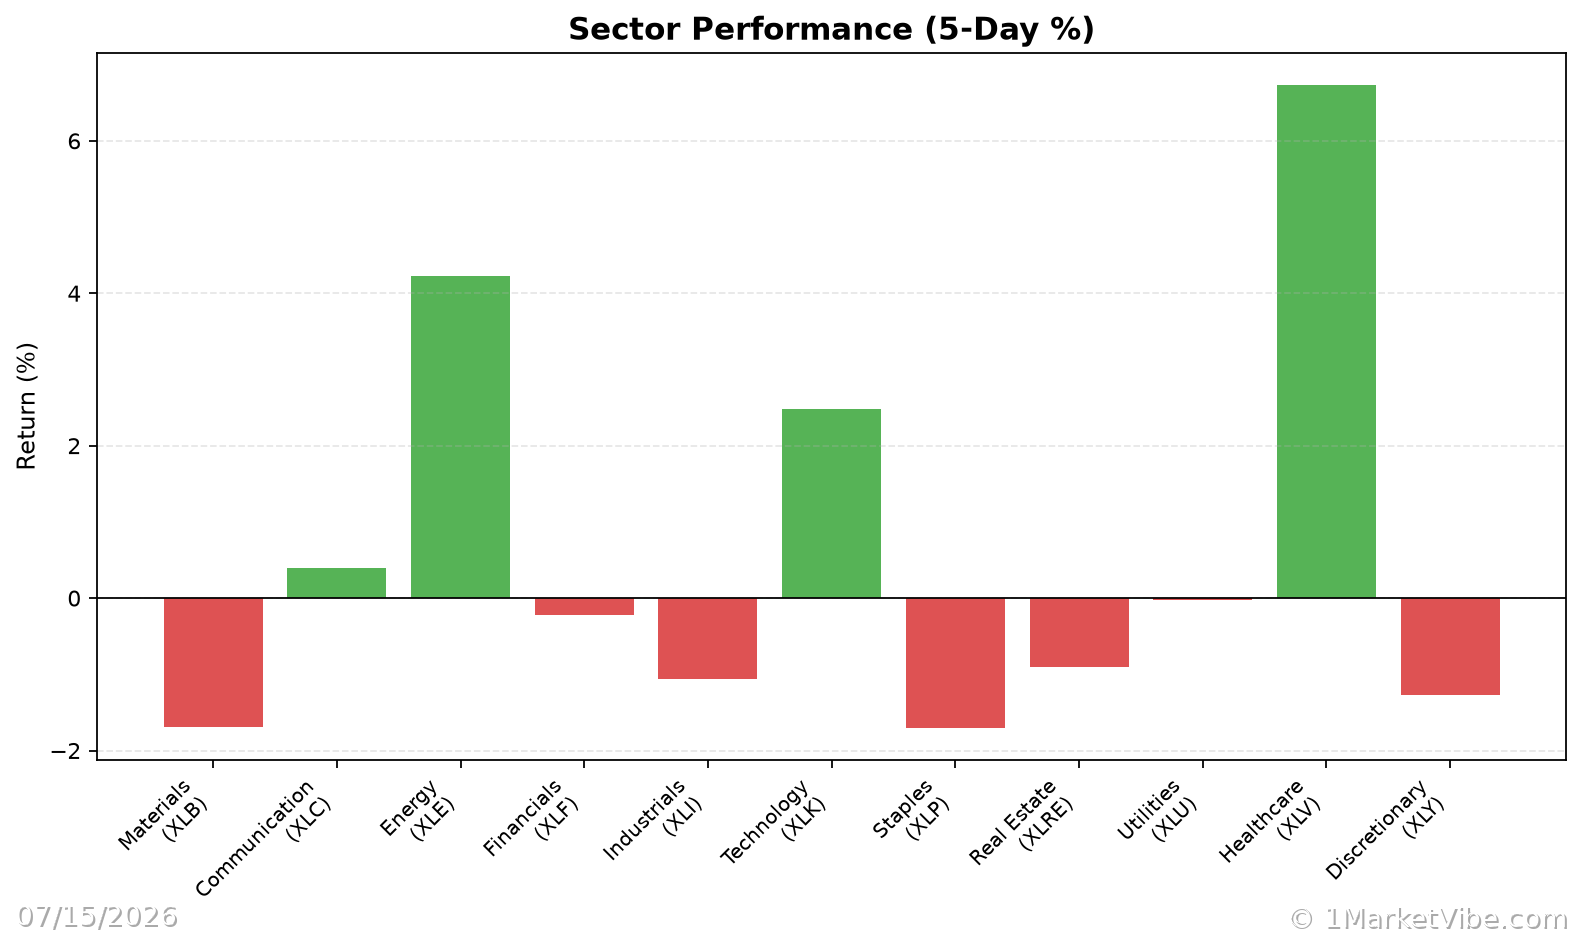
To see these breadth and risk metrics in one place each day, you can use the Decision Edge dashboard at 1marketvibe.com.
Disclaimer: This article is for informational purposes only and should not be considered financial advice. Always consult with a financial advisor before making investment decisions.