

US-Iran Tensions and Their Impact on Markets: Analyzing the CW Index at 4.6
- Authors

- Name
- MarketVibe Team
- @1marketvibe
US-Iran Tensions and Their Impact on Markets: Analyzing the CW Index at 4.6
1. Orientation – What Are We Explaining?
In this article, we will explore the Crash Warning Index (CWI), a composite metric designed to gauge market risk by analyzing several dimensions, including breadth, volatility, and defensive behavior. Currently, the CWI is reading at 4.6, which suggests a heightened level of caution among investors, particularly in light of the ongoing US-Iran tensions. Understanding the CWI is crucial for traders as it informs decisions about risk management and helps reduce blind spots related to geopolitical risks.
2. How It Works – Mechanics & Data
The Crash Warning Index (CWI) is constructed by aggregating various market indicators that reflect underlying risk conditions. These include:
- Breadth indicators: Such as the percentage of stocks above their 50-day moving average, which shows the overall health of market trends.
- Volatility measures: Like the Average True Range (ATR%) which indicates how much the market is moving relative to its price.
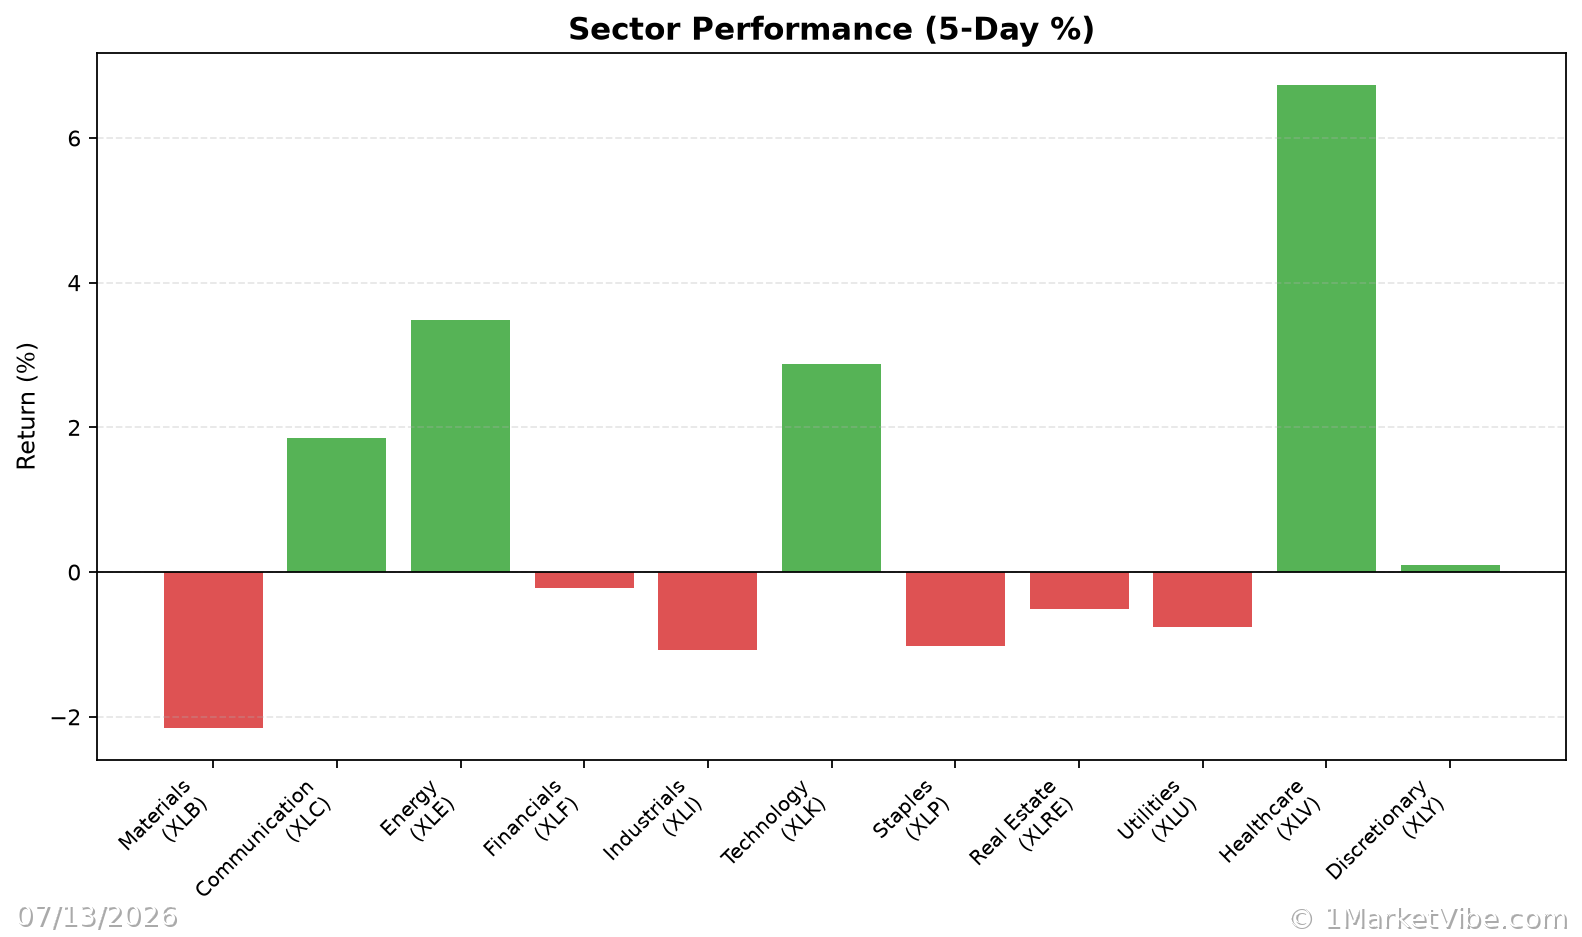
- Defensive behavior: Observed through sector performance, where a shift towards defensive sectors (e.g., utilities, consumer staples) can signal increased caution.
The CWI moves based on changes in these underlying components. For example, if market breadth deteriorates while volatility increases, the CWI will likely rise, indicating greater risk.
3. Interpretation – What Different Levels Tend to Mean
The CWI ranges provide insights into market conditions:
- Below 3: Generally indicates a stable market with low risk.
- Between 3 and 6: Suggests caution; markets may be vulnerable to shocks, especially from geopolitical events.
- Above 6: Signals elevated risk where corrections or significant volatility are more likely.
When the CWI is at 4.6, as it is currently, it reflects a market environment where caution is warranted, but not yet at a crisis level. This level often coincides with geopolitical uncertainties, such as the current US-Iran tensions, which can create an environment ripe for volatility spikes.
4. Real-World Scenarios – How This Shows Up in Markets
Scenario 1: Topping Environment
Imagine a scenario where major indices are reaching new highs, but the percentage of stocks above their 50-DMA is declining. This divergence often precedes a market top. In such a case, the CWI might rise to around 4.6, indicating that while the market appears strong, underlying breadth is weakening, suggesting caution.
Scenario 2: Volatility Spike
Consider a situation where geopolitical tensions, like those between the US and Iran, suddenly escalate. This could lead to a sharp increase in ATR%, reflecting heightened volatility. The CWI would likely increase, signaling traders to brace for potential market swings.
Scenario 3: Defensive Sector Leadership
In a climate where the CWI is around 4.6, defensive sectors may start to lead the market. This shift suggests that investors are seeking safety, anticipating potential downturns. Monitoring sector scores can provide additional confirmation of this defensive posture.
5. How to Use This Insight in a Process
- Emphasize Defense: When the CWI is high, consider reducing exposure to high-risk assets and increasing allocations to defensive sectors or safe-haven assets like gold or bonds.
- Monitor Breadth and Volatility: Use the Market Dashboard to track changes in breadth and volatility. A combination of weak breadth and rising volatility should prompt a more cautious approach.
- Stay Informed: Regularly check the Decision Edge dashboard for updates on the CWI and other risk metrics to stay ahead of potential market shifts.
6. Common Misuses & Misconceptions
- Standalone Signal: Avoid treating the CWI as a standalone entry or exit signal. It should be part of a broader risk management strategy.
- Ignoring Context: Always consider the broader market context, including sector rotation and geopolitical developments, when interpreting the CWI.
- Overreacting to Daily Changes: Focus on trends rather than day-to-day fluctuations in the CWI to avoid unnecessary trading decisions.
To see these breadth and risk metrics in one place each day, you can use the Decision Edge dashboard at 1marketvibe.com.
Disclaimer: This article is for informational purposes only and does not constitute financial advice. Always conduct your own research or consult with a financial advisor before making investment decisions.