SoftBank's $41 Billion Investment Signals Major Shift in AI Economics
- Authors

- Name
- MarketVibe Team
- @1marketvibe
SoftBank's $41 Billion Investment Signals Major Shift in AI Economics
In a move that has captured the attention of the global financial markets, SoftBank has announced a staggering $41 billion investment in OpenAI. This decision marks a significant shift in the economics of artificial intelligence (AI), with implications that ripple across the tech industry and investment landscapes. Understanding the nuances of this development requires a deep dive into the metrics and frameworks that guide market analysis, such as those provided by MarketVibe.
Investment Landscape
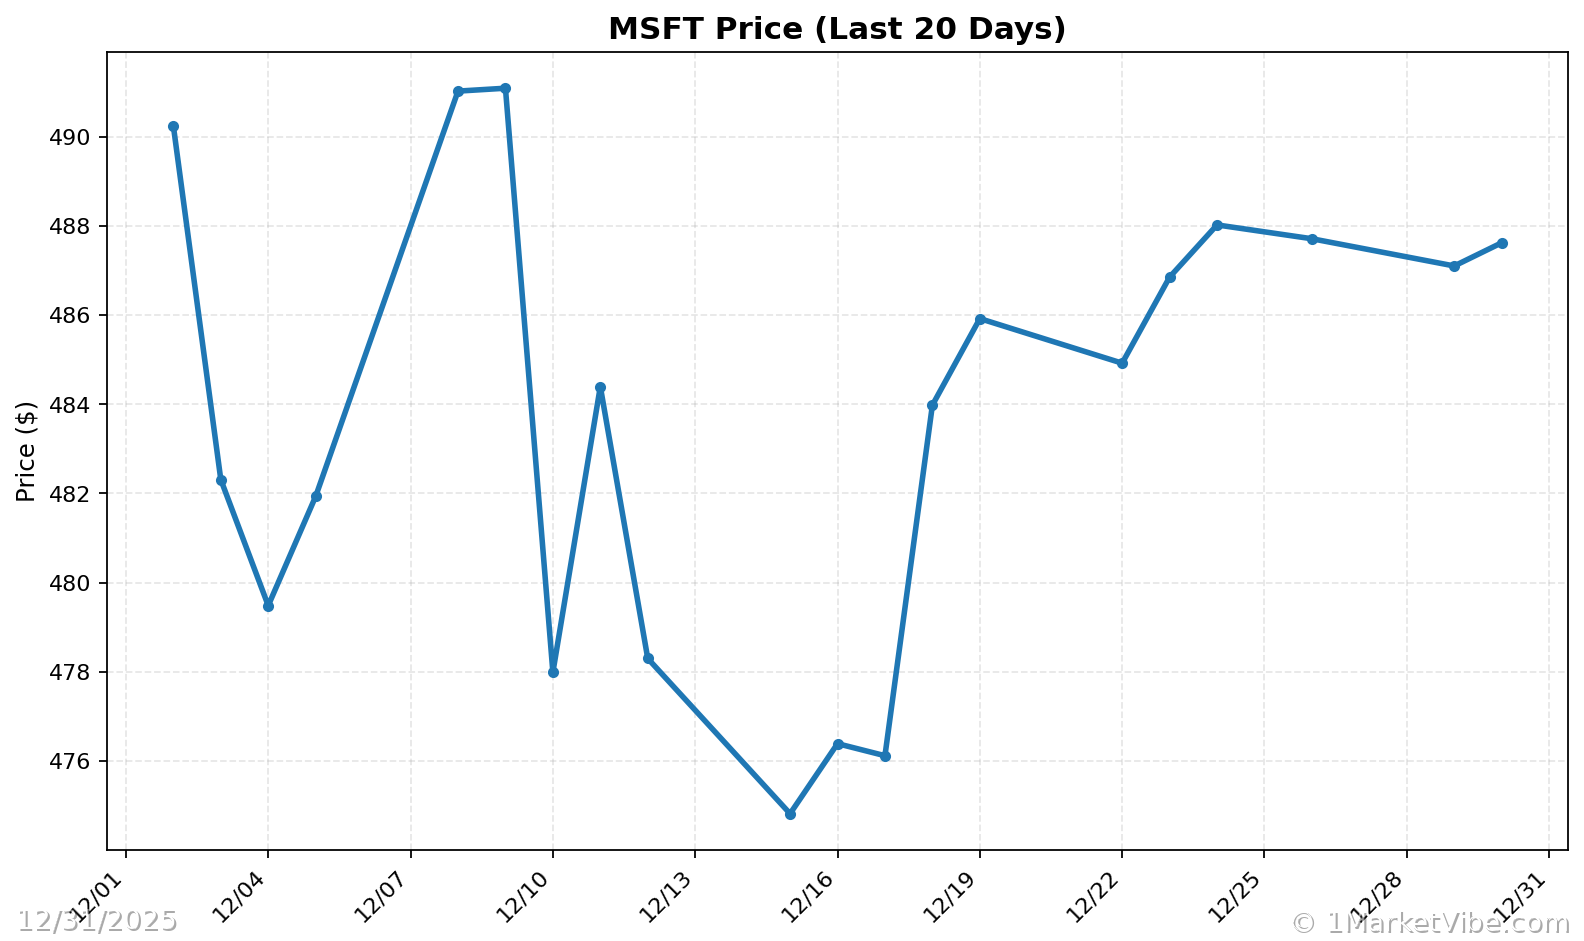
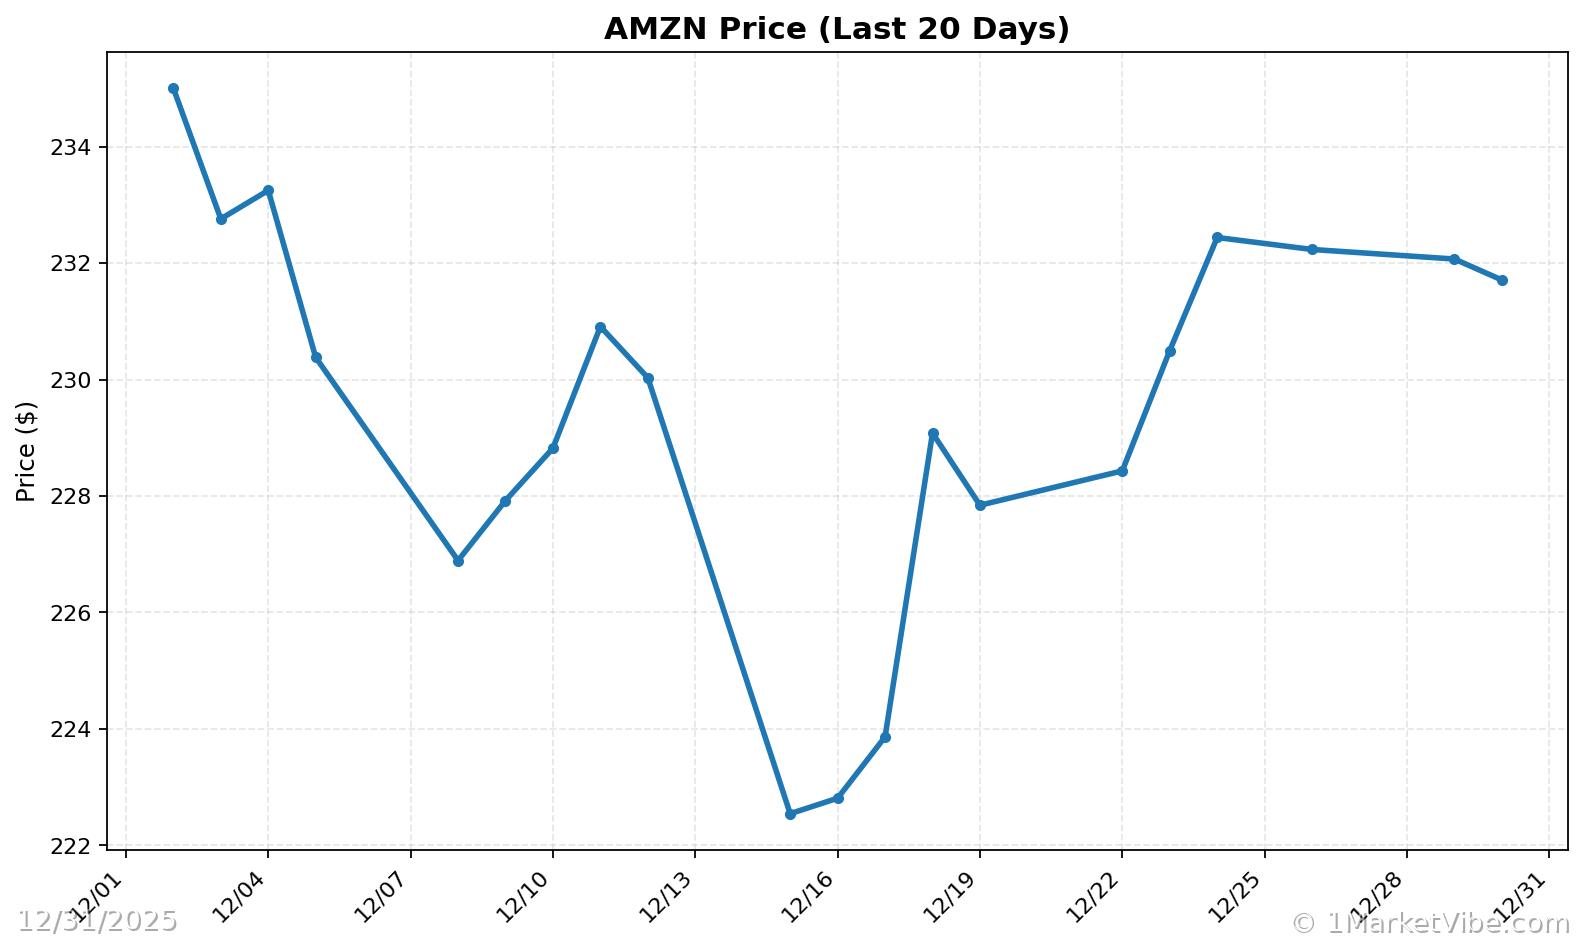
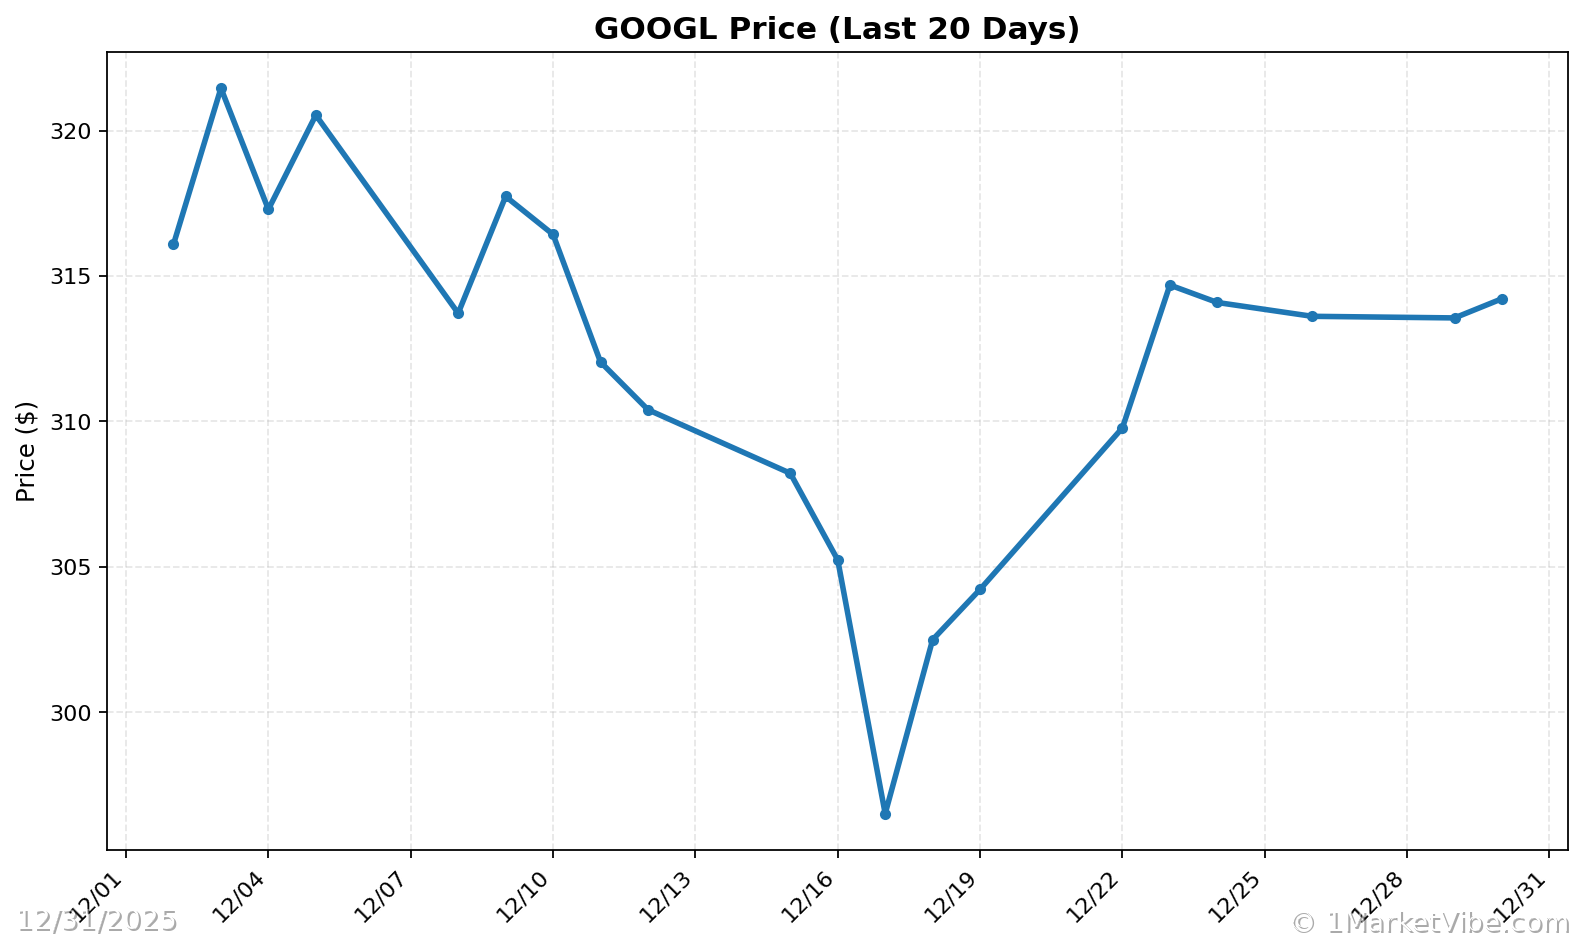
The scale of AI investments has been accelerating rapidly in recent years, with major players like Google, Microsoft, and Amazon committing billions to advance AI technologies. SoftBank's latest investment underscores the fierce competition and the high stakes involved in securing a leading position in the AI sector. This move is not just about financial commitment; it signals a strategic positioning to influence AI's future trajectory.
SoftBank's Strategy
SoftBank's rationale behind this massive investment likely includes diversifying its portfolio and gaining a foothold in one of the most transformative technologies of our time. By investing heavily in OpenAI, SoftBank aims to leverage AI's potential to drive innovation across various sectors, from healthcare to finance. This strategy could also provide SoftBank with a competitive edge, enabling it to capitalize on AI's growing demand.
Market Dynamics and the Role of MarketVibe Metrics
SoftBank's investment is a clear indicator of shifting dynamics in AI market economics. To understand these shifts, traders and investors can turn to MarketVibe's metrics, which offer insights into market breadth, volatility, and leadership.
Crash Warning Index (CWI)
The Crash Warning Index (CWI) is a composite metric that evaluates several risk dimensions, including breadth, volatility, and defensive behavior. With a current reading of 4.93, the CWI suggests a moderate level of risk in the market. This index serves as an early warning system, helping traders anticipate potential market corrections. When the CWI is above 6, it typically signals elevated risk, prompting traders to adopt a more defensive posture.
% Above 50-DMA
The % Above 50-DMA measures the percentage of stocks trading above their 50-day moving average, providing a snapshot of market breadth and trend health. A high percentage indicates strong market breadth and a healthy uptrend, while a low percentage suggests weakness or an oversold condition. This metric helps traders assess the underlying strength of the market and make informed decisions about risk exposure.
ATR%
The ATR% (Average True Range as a percentage of price) is a volatility metric that indicates how much a stock or index is expected to move. Low ATR% values often correspond to quiet, trending phases, while high ATR% values suggest choppy or unstable market conditions. Understanding volatility regimes is crucial for adjusting position sizes and managing risk effectively.
Real-World Scenarios
To illustrate how these metrics can inform trading decisions, consider the following scenarios:
Topping Environment: Imagine a scenario where the market index continues to rise, but the % Above 50-DMA declines. This divergence suggests deteriorating breadth, often a precursor to a market top. Traders might feel tempted to chase the rally, but a more informed view would advocate caution, focusing on defensive sectors and reducing new risk.
Bull Leg Surge: In a strong new bull leg, the % Above 50-DMA surges and remains elevated, indicating robust market breadth. This environment supports a more aggressive risk posture, allowing traders to add exposure to leading sectors, provided their setups align with broader market trends.
Volatility Spike: A sudden increase in ATR% could signal a volatility spike, often accompanied by a rising CWI. In such cases, traders should consider hedging strategies and reassess their risk exposure, as heightened volatility can lead to rapid market swings.
How to Use This Insight in a Process
Incorporating these insights into a structured trading process involves several practical steps:
- Monitor Breadth and Volatility: Use the % Above 50-DMA and ATR% to gauge market conditions. When breadth is weak and volatility is rising, emphasize defense and reduce new risk.
- Leverage CWI for Risk Management: The CWI provides a high-level view of market risk. A reading above 6 suggests caution, while lower readings may support a more aggressive stance.
- Utilize the Market Dashboard: The Decision Edge Dashboard offers a comprehensive view of market regimes and risk conditions. Use it to align your trading strategy with prevailing market trends.
Common Misuses & Misconceptions
Traders often misuse these metrics by:
- Treating Metrics as Stand-Alone Signals: Metrics like the CWI or % Above 50-DMA should not be used in isolation. They are part of a broader analytical framework.
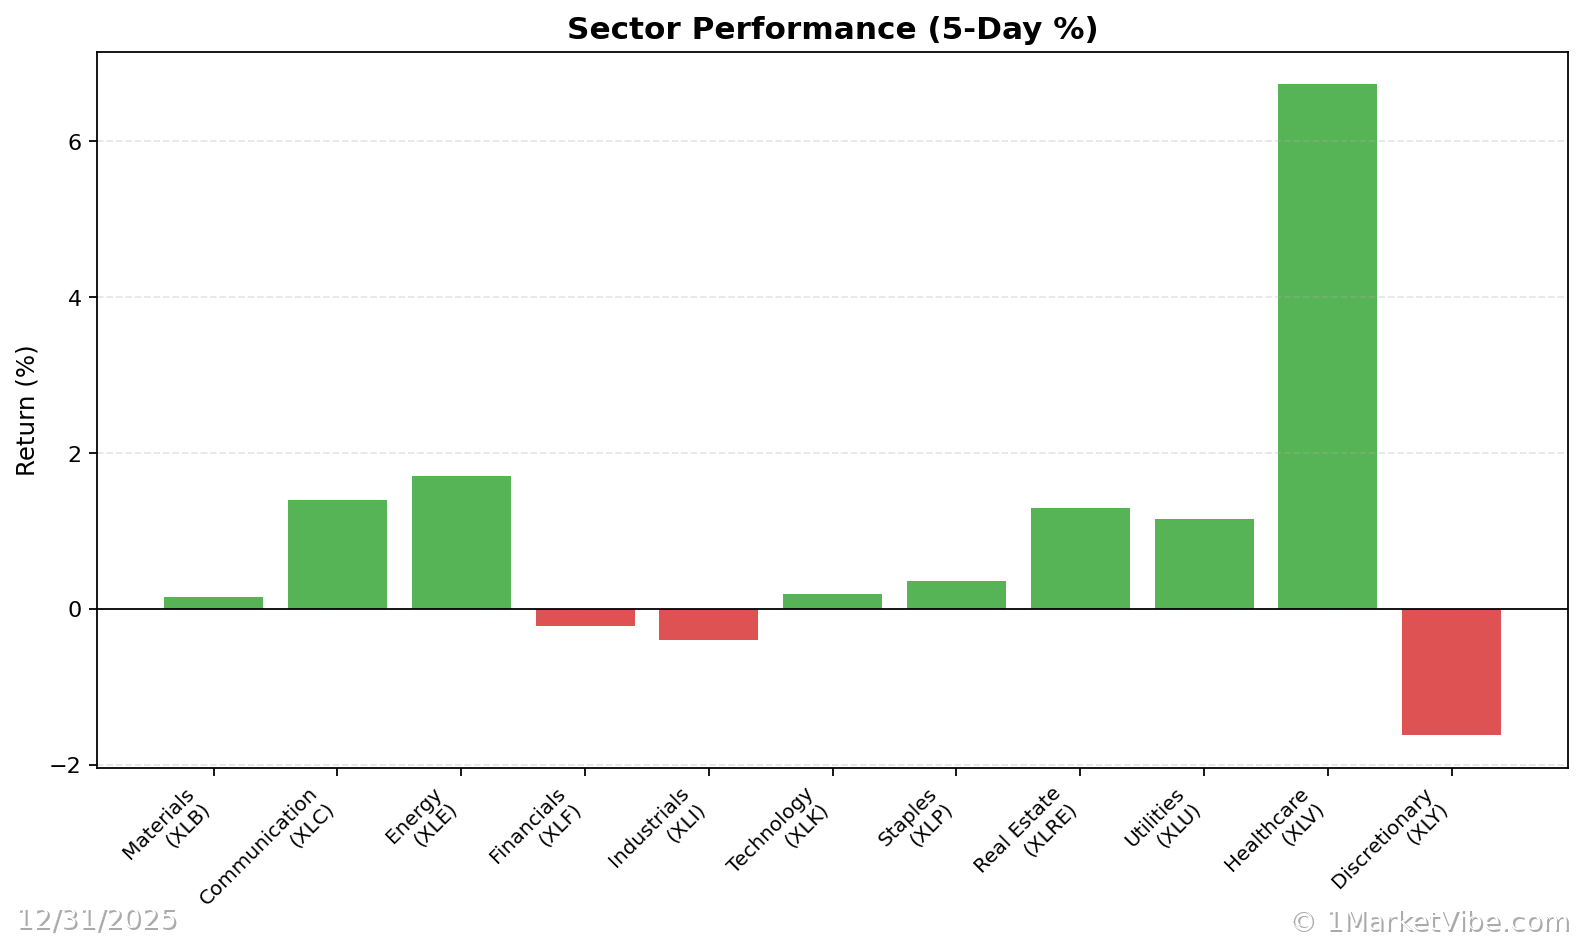
- Ignoring Context: It's crucial to consider sector rotation and market cycles when interpreting these metrics. Contextual analysis enhances decision-making.
- Overreacting to One-Day Changes: Short-term fluctuations can be misleading. Focus on trends and sustained movements for a more accurate market assessment.
To see these breadth and risk metrics in one place each day, you can use the Decision Edge dashboard at 1marketvibe.com.
This article is for informational purposes only and does not constitute financial advice. Always conduct your own research or consult with a financial advisor before making investment decisions.
Charts