
PG&E Outage Affects 11,000 Customers and Market Implications
- Authors

- Name
- MarketVibe Team
- @1marketvibe
PG&E Outage Affects 11,000 Customers and Market Implications
Introduction
On December 28, 2025, a power outage in San Francisco left over 11,000 Pacific Gas and Electric (PG&E) customers without electricity. This incident, affecting areas such as Golden Gate Park and Richmond, highlights ongoing infrastructure challenges and raises questions about broader market implications, particularly for the utility sector and investor sentiment towards PG&E. In this article, we will explore these implications using MarketVibe's metrics and frameworks to provide a structured understanding of the market's response to such events.
Impact on Residents and Businesses
The power outage disrupted daily activities for thousands of residents, affecting everything from household routines to local business operations. Businesses faced operational challenges, potentially impacting their revenue and customer satisfaction. These disruptions can lead to a ripple effect, influencing consumer confidence and economic activity in the region.
Infrastructure Challenges and PG&E's Response
PG&E's infrastructure issues have been under scrutiny for years, with frequent outages raising public safety concerns. The utility company's statement attributed the latest outage to an overhead equipment failure. PG&E has pledged to take measures to restore power and improve infrastructure, but the recurring nature of these outages continues to challenge their credibility and investor confidence.
Broader Market Considerations
Utility Sector Implications
The utility sector is particularly sensitive to infrastructure reliability and regulatory scrutiny. Investors often monitor these factors closely, as they can significantly impact a company's financial performance and stock price. In this context, MarketVibe's Crash Warning Index (CWI) and Market Dashboard can provide valuable insights into the risk environment and investor sentiment.
Crash Warning Index (CWI)
The Crash Warning Index (CWI) is a composite metric that assesses market risk by evaluating breadth, volatility, and defensive behavior. It helps traders understand the underlying risk conditions and adjust their strategies accordingly. A CWI reading above 6 indicates elevated risk, suggesting that corrections are more likely. In the case of PG&E, a high CWI could reflect increased investor caution due to infrastructure concerns and regulatory pressures.
Market Dashboard
The Market Dashboard serves as a high-level overview of market conditions, offering insights into risk-taking behavior and sector performance. In the context of the PG&E outage, the Dashboard can help traders identify shifts in investor sentiment towards the utility sector and adjust their exposure accordingly.
Real-World Scenarios
Scenario 1: Topping Environment
Imagine a scenario where the broader market is in a topping phase, with major indices grinding higher despite deteriorating breadth. In this environment, the % Above 50-DMA metric might show a declining trend, indicating weakening market health. Traders might be tempted to chase the rally, but a more informed view would emphasize caution, especially if the CWI is elevated.
Scenario 2: Volatility Spike
Consider a situation where a sudden infrastructure failure, like the PG&E outage, leads to a spike in market volatility. The ATR% (Average True Range as a percentage of price) would likely increase, signaling a shift to a more unstable phase. Traders aware of this volatility shift might reduce their position sizes or employ hedging strategies to manage risk.
Scenario 3: Defensive Leadership
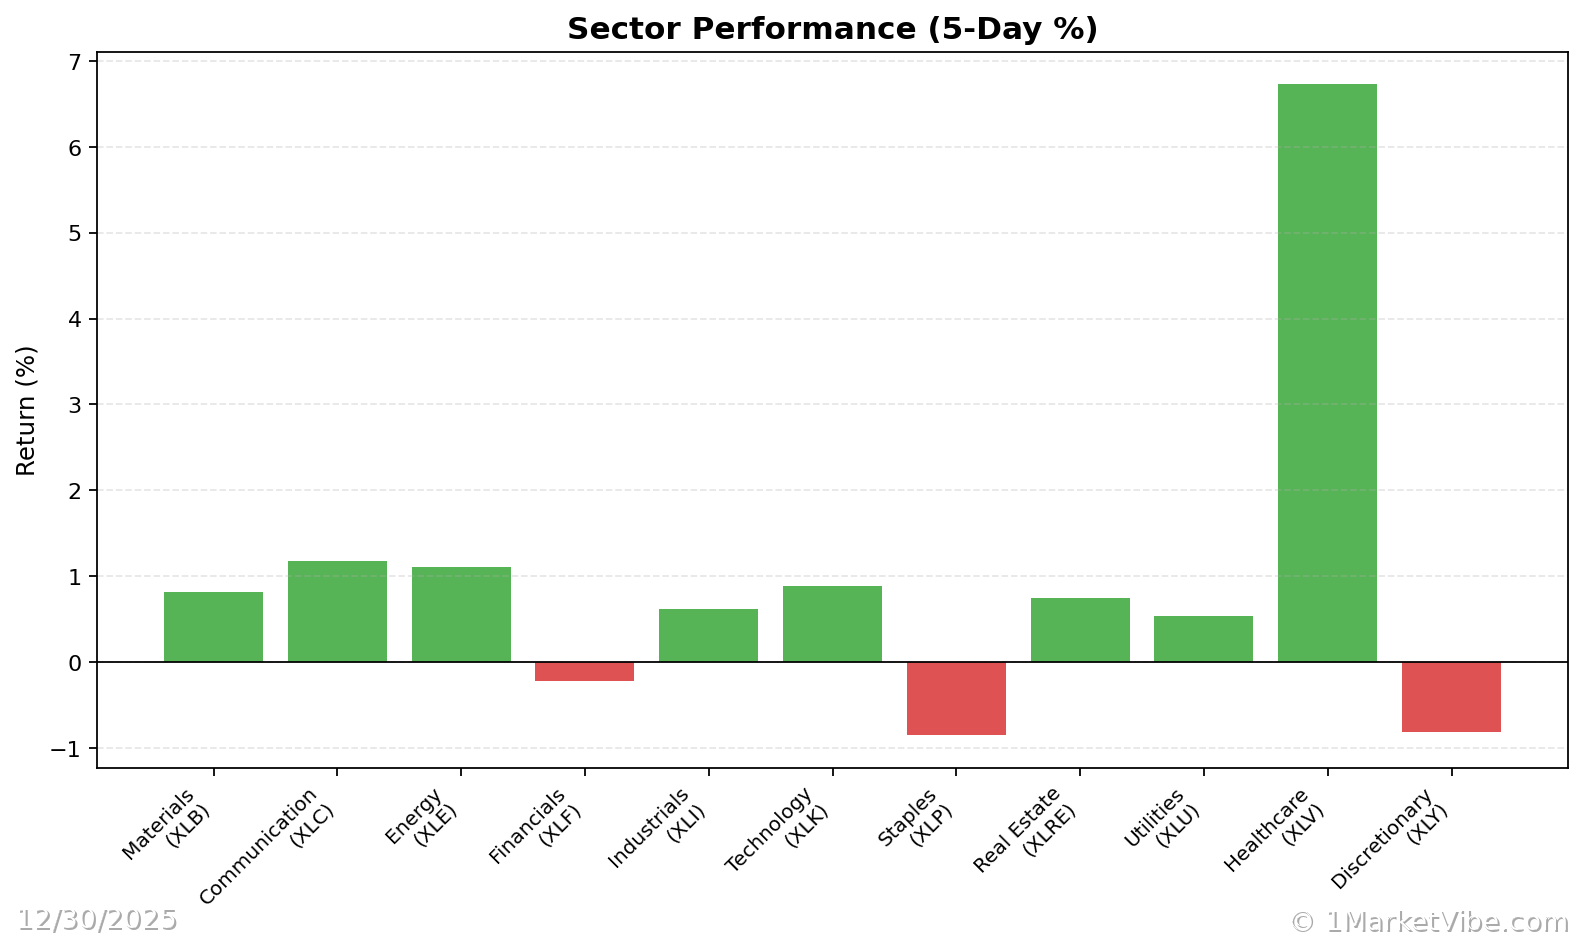
In a market where defensive sectors like utilities, staples, and healthcare are leading, the New High–New Low (NH–NL) indicator might show contraction, reflecting a cautious market stance. Traders could interpret this as a signal to prioritize defensive positions, especially if the Market Dashboard indicates a Climate of Warning or At-Risk.
How to Use This Insight in a Process
- Emphasize Defense: When breadth is weak and CWI is high, focus on defensive strategies and reduce new risk exposure.
- Monitor Leadership: If breadth and leadership broaden, consider adding exposure, provided your setups align with market conditions.
- Use the Market Dashboard: Leverage the Dashboard as a regime label, then verify with internal metrics for confirmation.
Common Misuses & Misconceptions
- Standalone Signal Misuse: Traders often misuse metrics like CWI as standalone entry signals. Instead, use them to guide risk posture and expectations.
- Ignoring Context: Failing to consider sector rotation and time frame can lead to misinterpretation. Always analyze metrics within the broader market context.
- Overreacting to Daily Changes: One-day metric changes can be misleading. Focus on trends and sustained levels for more reliable insights.
To see these breadth and risk metrics in one place each day, you can use the Decision Edge dashboard at 1marketvibe.com.
DISCLAIMER: This article is for informational purposes only and does not constitute financial advice. Always conduct your own research before making investment decisions.