


Rising Oil Prices and Their Implications for Investors
As Brent crude oil prices approach $100 per barrel, investors are increasingly focused on the potential ripple effects across global markets. Understanding how rising oil prices can influence inflation, equity markets, and investor strategies is crucial for navigating the current economic landscape. This article will explore these dynamics and how MarketVibe's metrics, such as the Crash Warning Index (CWI), can provide valuable insights into market conditions.
Current Market Conditions
Recent trends have shown stock futures and major averages experiencing losses, partly due to the upward pressure on oil prices. This trend has heightened investor concerns about inflation and its potential impact on economic growth. Rising oil prices can lead to increased costs for businesses and consumers, influencing market sentiment and investment decisions.
Inflationary Pressures
Oil prices are a significant driver of inflation, as they affect transportation, manufacturing, and energy costs. When oil prices rise, the cost of goods and services often follows, leading to higher consumer and wholesale inflation. This can erode purchasing power and dampen economic growth, prompting central banks to consider tightening monetary policies.
Equity Market Implications
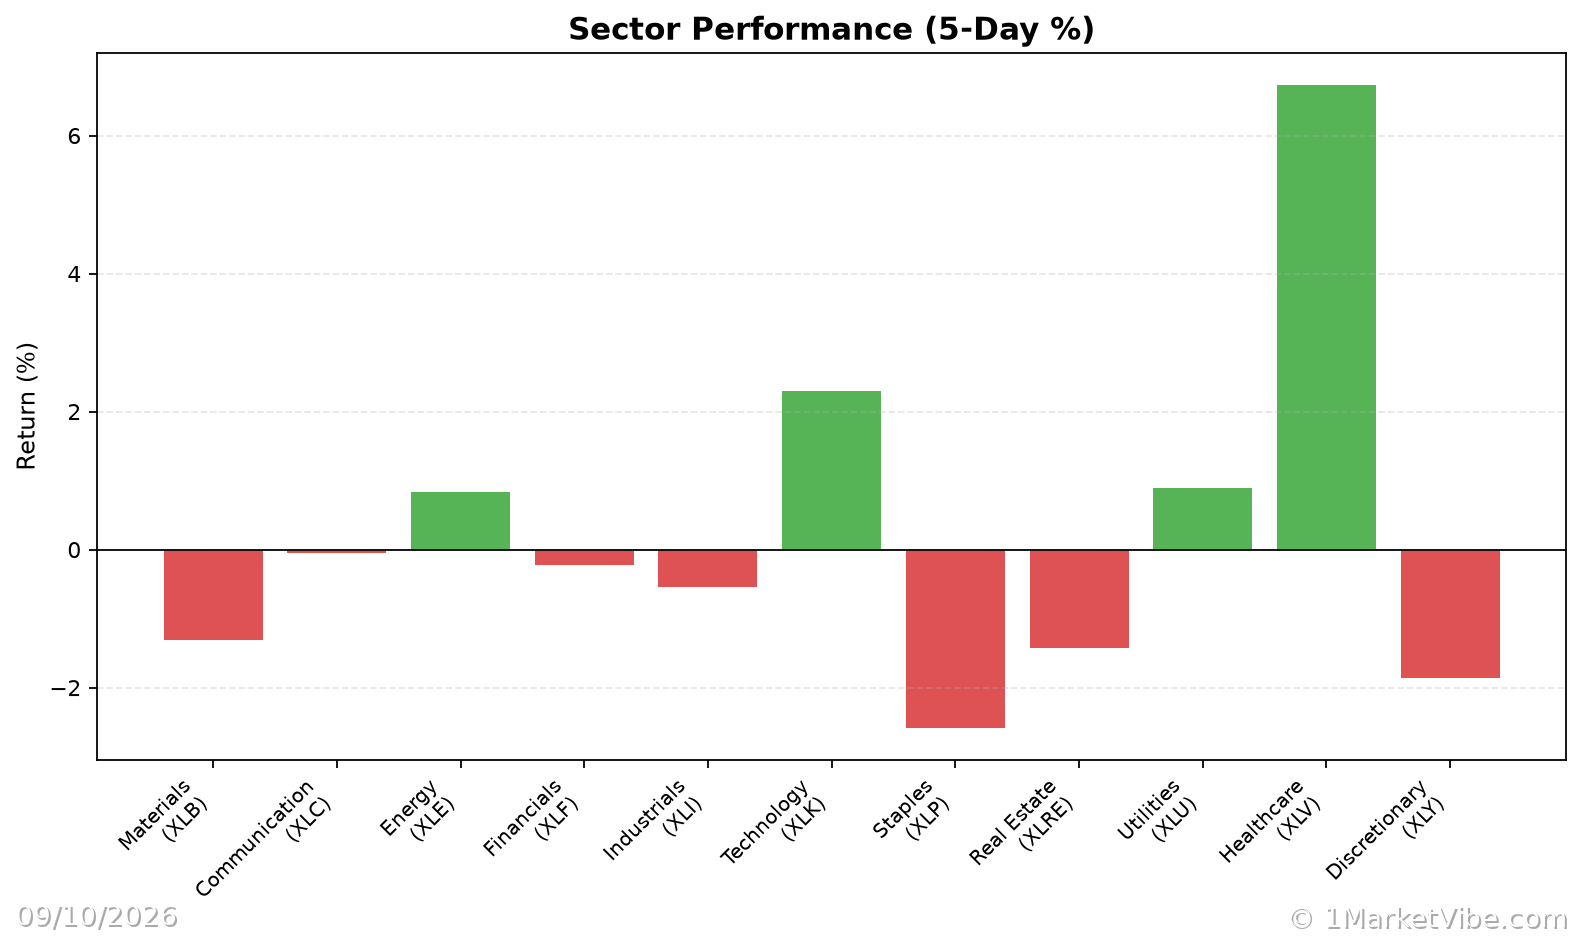
Rising oil prices can have varied effects on equity markets. Energy sector stocks may benefit from higher oil prices, while sectors reliant on oil as an input, such as transportation and manufacturing, may face headwinds. Investors need to be mindful of these dynamics and adjust their portfolios accordingly.
CW Index Insights
The Crash Warning Index (CWI) is a composite metric that assesses market risk by considering factors such as breadth, volatility, and defensive behavior. With the current CWI reading at 6.27, the index suggests elevated risk levels, indicating that corrections may become more likely. The CWI's ability to provide early warnings, typically 4-6 weeks in advance, can help investors anticipate potential market shifts.
Global Economic Factors
International markets also play a role in oil price dynamics. For example, China's recent inflation rebound, driven by higher commodity costs, highlights the interconnectedness of global economies. As oil prices rise, countries with significant energy imports may experience increased inflationary pressures, affecting their economic stability and growth prospects.
Market Sentiment Analysis
Currently, market sentiment remains neutral, with factors such as geopolitical tensions and economic data contributing to volatility. Investors should monitor these developments closely, as shifts in sentiment can lead to rapid changes in market conditions.
Real-World Scenarios
To illustrate how these dynamics play out in real markets, consider the following scenarios:
Topping Environment: As oil prices rise, breadth indicators like the % Above 50-DMA may show deterioration, even if major indices continue to climb. This divergence can signal a potential market top, prompting traders to exercise caution and reduce exposure.
Bull Leg Surge: In a strong bull market, a surge in the % Above 50-DMA indicates robust breadth, suggesting that the rally is supported by a wide range of stocks. Investors may consider increasing exposure, provided their setups align with market conditions.
Volatility Spike: A sudden increase in oil prices can lead to a spike in ATR%, reflecting heightened market volatility. During such periods, the CWI may also accelerate, signaling increased risk. Traders should focus on risk management and consider hedging strategies to protect their portfolios.
How to Use This Insight in a Process
To effectively incorporate these insights into your trading process:
- Emphasize Defense: When breadth is weak and the CWI is high, prioritize defensive strategies and reduce new risk exposure.
- Broaden Exposure: If breadth and leadership indicators show strength, be open to adding exposure, but only if your trading setups are favorable.
- Monitor Market Dashboard: Use the Market Dashboard as a high-level regime label, then confirm with internal metrics like breadth and volatility.
Common Misuses & Misconceptions
Traders often misuse metrics by:
- Treating as Stand-Alone Signals: Metrics like the CWI should not be used as standalone entry signals. Instead, integrate them into a broader analysis framework.
- Ignoring Context: Consider sector rotation and time frames when interpreting metrics. A high CWI in an energy-led rally may differ from one in a tech-driven market.
- Overreacting to One-Day Changes: Avoid making decisions based on single-day metric fluctuations. Look for sustained trends and corroborating signals.
To see these breadth and risk metrics in one place each day, you can use the Decision Edge dashboard at 1marketvibe.com.
This article is for informational purposes only and does not constitute financial advice. Always conduct your own research or consult a financial advisor before making investment decisions.