


Understanding the Market Dynamics: Stock Futures and Inflation Data
In the world of trading, understanding the underlying market dynamics is crucial for making informed decisions. Today, we'll explore how stock futures are reacting ahead of crucial inflation data and how MarketVibe's metrics can provide a deeper insight into these movements.
1. Orientation – What Are We Explaining?
The focus of this discussion is on stock futures and their movement in anticipation of inflation data. Stock futures are contracts to buy or sell a stock at a predetermined price on a specific date in the future. They are often used by traders to speculate on the future direction of stock prices or to hedge other investments.
Why Traders Should Care:
- Decision Making: Stock futures provide insights into market sentiment and expectations about future price movements.
- Blind Spot Reduction: They help traders anticipate market reactions to economic data releases, such as inflation reports.
- Structured Process: By understanding futures, traders can better align their strategies with market expectations and manage risk effectively.
2. How It Works – Mechanics & Data
Stock Futures Movement:
- Stock futures are influenced by a variety of factors, including economic indicators, geopolitical events, and market sentiment.
- In the current context, the anticipation of inflation data is a significant driver. Traders use futures to position themselves ahead of the release, reflecting their expectations of how the data might impact the market.
MarketVibe Metrics:
- % Above 50-DMA: This breadth indicator measures the percentage of stocks trading above their 50-day moving average, providing insight into the overall market trend.
- Crash Warning Index (CWI): A composite index that assesses risk by considering factors like breadth, volatility, and defensive behavior.
- ATR% (Average True Range Percentage): This volatility metric measures the average range of price movement relative to the stock's price, indicating market stability or instability.
Day-to-Day Movements:
- Economic Data: Inflation reports, like the Producer Price Index (PPI) and Consumer Price Index (CPI), can cause significant shifts in futures as traders adjust their expectations.
- Geopolitical Events: Events such as wars or political instability can lead to increased volatility and impact futures prices.
3. Interpretation – What Different Levels Tend to Mean
Ranges and Regimes:
- % Above 50-DMA:
- Above 70%: Indicates strong market breadth and a healthy uptrend.
- Below 30%: Suggests weak breadth and potential oversold conditions.
- CWI:
- Above 6: Signals elevated risk, with a higher likelihood of market corrections.
- Below 3: Indicates a stable environment with lower risk.
- ATR%:
- Low ATR%: Corresponds to quiet, trending phases.
- High ATR%: Indicates choppy or unstable market conditions.
Common Combinations:
- Strong Breadth + Low Volatility: Typically seen in stable bull markets.
- Weak Breadth + Rising Volatility: Often precedes market corrections or downturns.
4. Real-World Scenarios – How This Shows Up in Markets
Scenario 1: Topping Environment
- Metrics: % Above 50-DMA declines while major indices continue to rise, indicating narrowing leadership.
- Trader Temptation: Continue buying into the rally.
- Informed Response: Recognize the risk of a potential top and consider reducing exposure.
Scenario 2: Bull Market Surge
- Metrics: % Above 50-DMA surges above 70%, indicating broad participation in the rally.
- Trader Temptation: Hesitate to enter due to fear of heights.
- Informed Response: Confidently add exposure, ensuring setups align with market strength.
Scenario 3: Volatility Spike
- Metrics: ATR% jumps significantly, and CWI rises above 6.
- Trader Temptation: Panic sell or overreact to volatility.
- Informed Response: Focus on risk management, possibly hedging positions or reducing leverage.
5. How to Use This Insight in a Process
Practical Guidelines:
- Weak Breadth and High CWI: Emphasize defensive strategies and reduce new risk exposure.
- Broadening Breadth and Leadership: Be open to increasing exposure if setups are favorable.
- Market Dashboard: Use it to label the current regime and verify with internal metrics for confirmation.
6. Common Misuses & Misconceptions
Misuses:
- Stand-Alone Signal: Treating futures or any single metric as a definitive entry signal.
- Alternative: Use them as part of a broader analysis framework.
- Ignoring Context: Failing to consider sector rotation or time frame.
- Alternative: Always contextualize metrics within the broader market environment.
- Overreacting to One-Day Changes: Making decisions based on daily fluctuations.
- Alternative: Focus on trends and sustained movements.
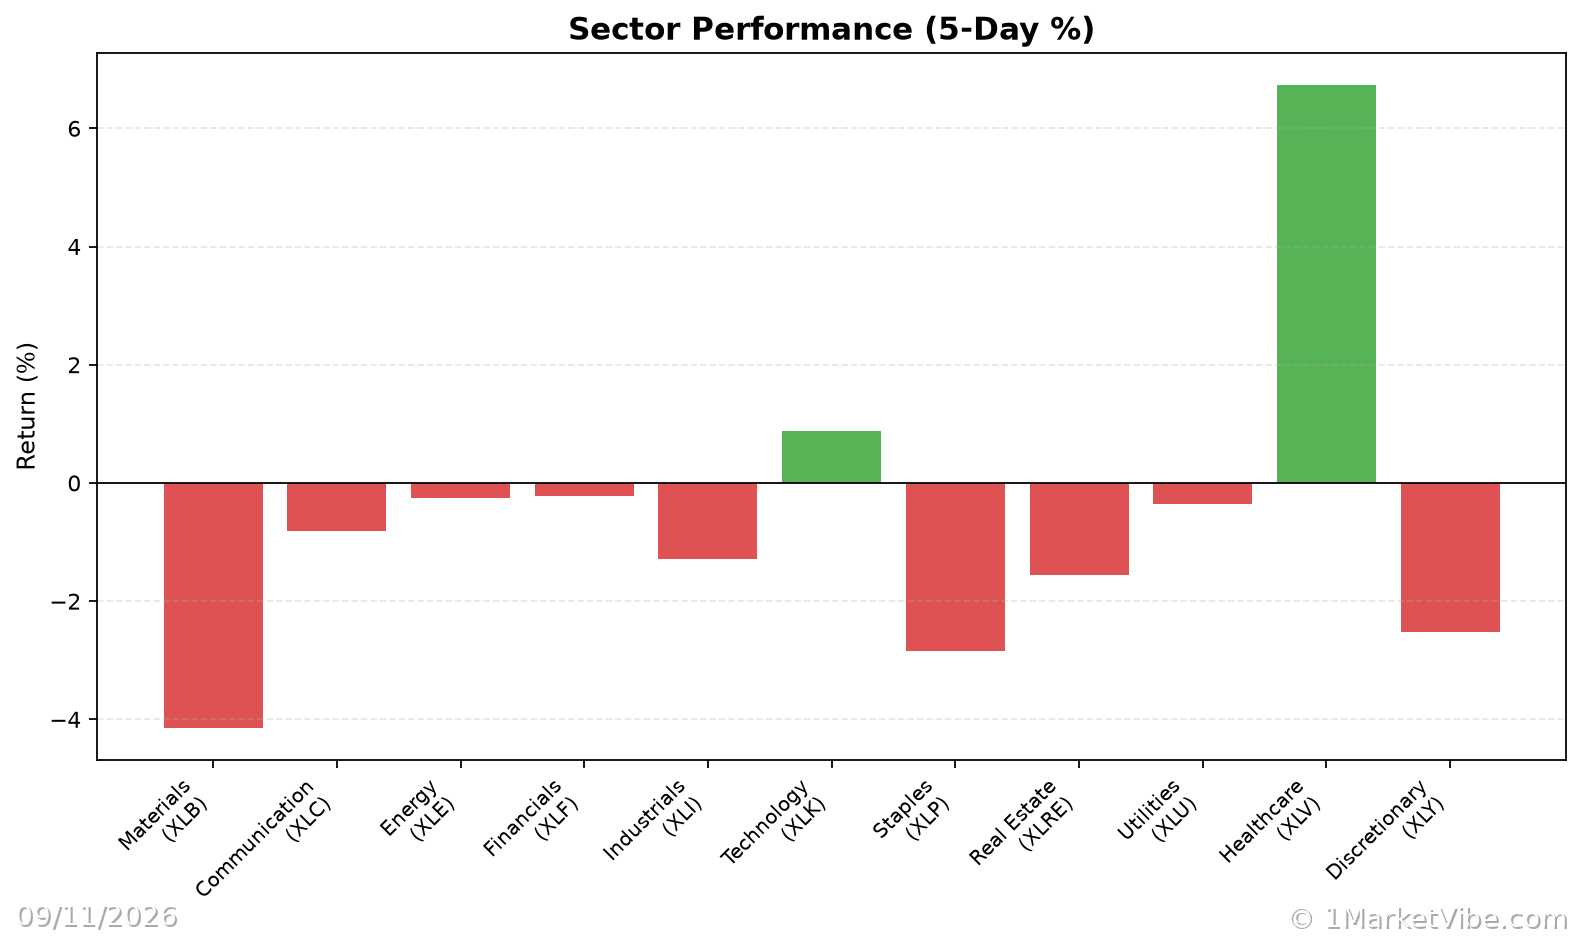
To see these breadth and risk metrics in one place each day, you can use the Decision Edge dashboard at 1marketvibe.com.
Disclaimer: This article is for informational purposes only and does not constitute financial advice. Please consult a financial advisor for personalized advice.