


How $100 Oil Indicates Market Volatility Insights
In recent months, oil prices have surged to the $100 mark, a level that often signals broader implications for market volatility. Understanding how this affects the market can provide traders with valuable insights into potential risk conditions and help refine their decision-making processes. This article will explore how high oil prices interact with market volatility, using MarketVibe's metrics to provide a structured view of the current market environment.
Orientation – What Are We Explaining?
The main focus here is on the Crash Warning Index (CWI) and how it relates to oil prices reaching $100. The CWI is a composite metric that assesses several dimensions of market risk, including breadth, volatility, and defensive behavior. Traders should care about this because it offers a high-level view of market risk, helping to inform decisions about risk exposure and portfolio adjustments. By understanding the CWI, traders can reduce blind spots related to sudden market shifts and incorporate this insight into a more structured trading process.
How It Works – Mechanics & Data
The Crash Warning Index (CWI) is constructed by combining various indicators that measure market breadth, volatility, and defensive sector performance. It includes:
- Breadth: The percentage of stocks above their 50-day moving average (% Above 50-DMA), which indicates the overall health of market trends.
- Volatility: Measured by the Average True Range percentage (ATR%), which reflects the market's price movement relative to its price.
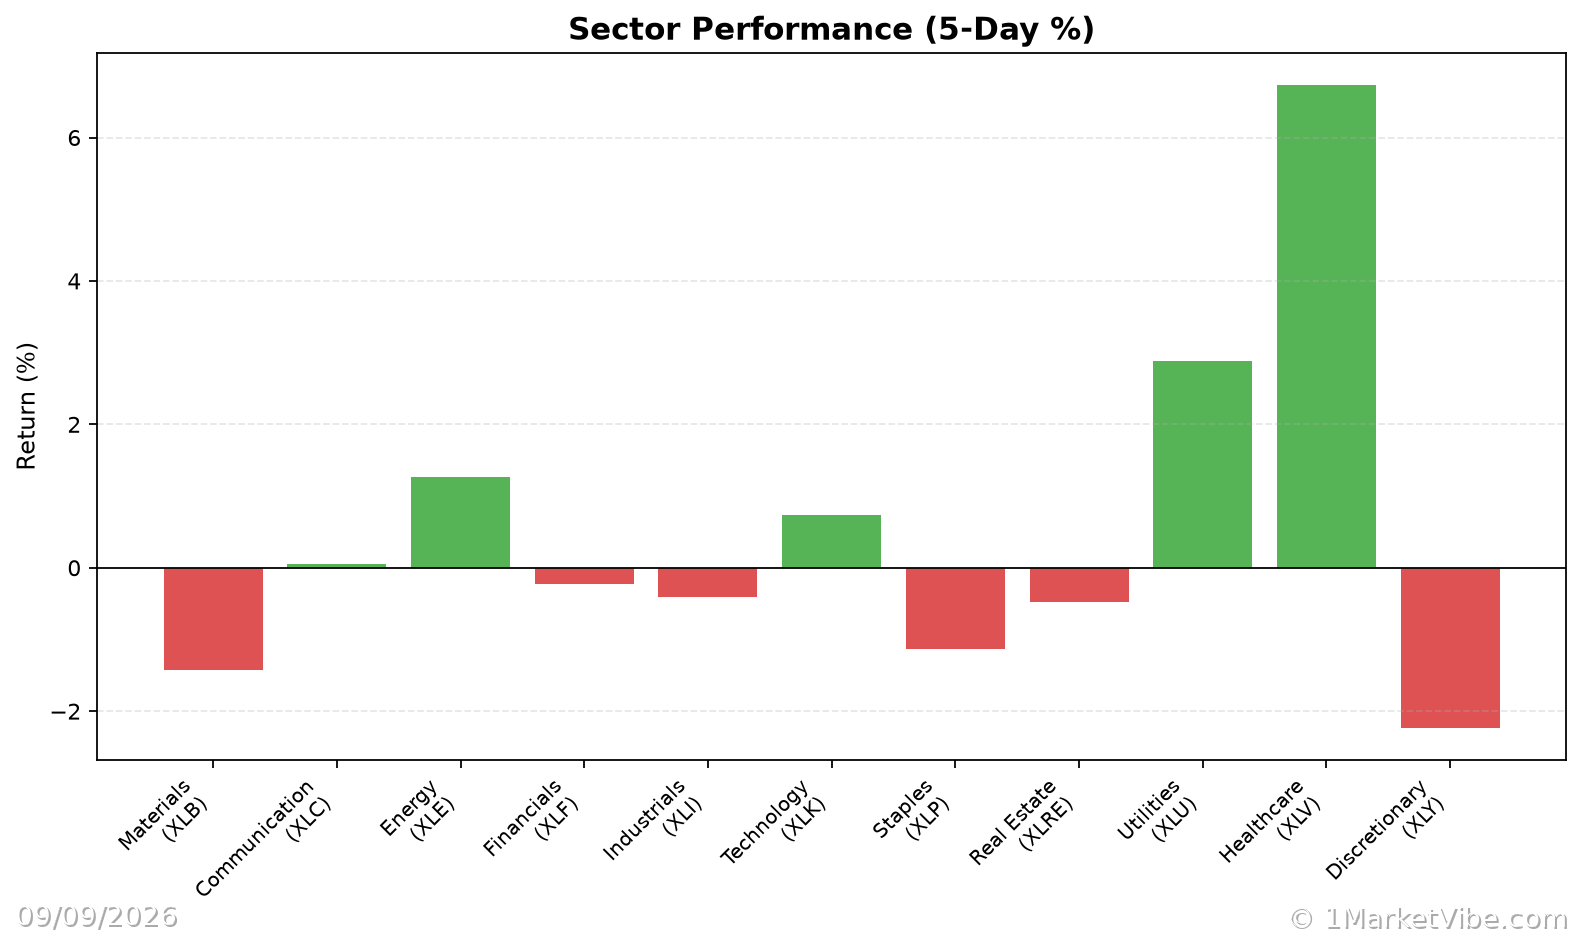
- Defensive Behavior: Observed through the performance of defensive sectors like utilities and consumer staples.
The CWI is dynamic, changing with daily market conditions. For example, a rise in oil prices to $100 can increase market volatility, which in turn might elevate the CWI if other risk factors align.
Interpretation – What Different Levels Tend to Mean
Ranges and Regimes:
- CWI below 3: Generally indicates a stable market with low risk of correction.
- CWI between 3 and 6: Suggests moderate risk, where traders should be cautious but not overly defensive.
- CWI above 6: Signals elevated risk, where market corrections become more likely, and traders should consider defensive strategies.
Common Combinations:
- Strong Breadth + Low Volatility: Indicates a healthy market environment, often seen in bull markets.
- Weak Breadth + Rising Volatility: A warning sign of potential market instability, often preceding corrections.
- Defensive Sectors Leading: Suggests a risk-off environment, where investors are seeking safety.
Real-World Scenarios – How This Shows Up in Markets
Scenario 1: Topping Environment
Imagine a situation where the overall market index is grinding higher, but the % Above 50-DMA is declining. This indicates that fewer stocks are participating in the rally, a classic sign of a market top. In this scenario, the CWI might rise as volatility increases and defensive sectors start to outperform.
Scenario 2: Bull Leg Surge
In a strong new bull leg, the % Above 50-DMA surges and remains elevated, indicating broad participation in the rally. Here, the CWI would likely remain low, reflecting a stable, low-risk environment.
Scenario 3: Volatility Spike
Consider a sudden spike in oil prices to $100, leading to increased market volatility. The ATR% would rise, potentially pushing the CWI above 6. Traders might feel tempted to panic-sell, but a more informed view would suggest reassessing risk exposure and possibly hedging against further volatility.
How to Use This Insight in a Process
- When breadth is weak and CWI is high: Emphasize defense and reduce new risk. Consider reallocating to more stable, defensive sectors.
- When breadth and leadership broaden out: Be more open to adding exposure, provided your setups align with your strategy.
- Use the Market Dashboard: As a high-level regime label, then check internals for confirmation. This helps maintain a balanced view of market conditions.
Common Misuses & Misconceptions
Treating CWI as a Stand-Alone Entry Signal: The CWI should guide risk posture, not dictate specific trades. Always consider the broader market context.
Ignoring Context: Focusing solely on the CWI without considering sector rotation or time frame can lead to misinformed decisions.
Overreacting to One-Day Changes: The CWI is more valuable as a trend indicator rather than reacting to daily fluctuations.
By understanding how oil prices at $100 can influence market volatility and the CWI, traders can better navigate risk conditions and make more informed decisions. To see these breadth and risk metrics in one place each day, you can use the Decision Edge dashboard at 1marketvibe.com.
Disclaimer: This article is for informational purposes only and should not be considered financial advice. Always conduct your own research or consult with a financial advisor before making investment decisions.