

Private Credit Warning as Loan Surge Reintroduces Market Stress to 2017 Levels
- Authors

- Name
- MarketVibe Team
- @1marketvibe
Understanding the Private Credit Warning and Market Stress Levels
In recent months, the financial landscape has been marked by a notable surge in troubled loans within the private credit sector. This development has reintroduced market stress to levels reminiscent of 2017. For traders and investors, understanding the implications of this trend is crucial. This article will explore how MarketVibe's metrics, particularly the Crash Warning Index (CWI), can provide insights into current market conditions and inform better decision-making processes.
The Crash Warning Index (CWI) and Its Importance
The Crash Warning Index (CWI) is a composite metric designed to gauge the risk of significant market corrections. It incorporates several dimensions, including market breadth, volatility, and defensive behavior. Traders should care about the CWI because it helps identify periods of elevated risk, allowing them to adjust their risk exposure accordingly. By understanding the CWI, traders can reduce blind spots in their market analysis and integrate this insight into a structured trading process.
How the CWI Works
The CWI is constructed by analyzing various market indicators:
- Breadth: Measures the percentage of stocks trading above their 50-day moving average (50-DMA). A lower percentage indicates weaker market health.
- Volatility: Assessed through metrics like the Average True Range percentage (ATR%), which reflects price volatility relative to the asset's price.
- Defensive Behavior: Observed through sector rotation, where defensive sectors like utilities and consumer staples outperform during risk-off periods.
The CWI fluctuates based on changes in these underlying components. For instance, a decline in the percentage of stocks above their 50-DMA or an increase in ATR% can elevate the CWI, signaling increased market risk.
Interpreting CWI Levels
The CWI is typically interpreted through specific ranges:
- Below 3: Indicates a low-risk environment, often associated with stable market conditions.
- Between 3 and 6: Suggests moderate risk, where caution is advised.
- Above 6: Reflects high risk, with a greater likelihood of market corrections.
Currently, the CWI stands at 5.6, indicating a heightened risk environment. This level suggests that traders should be vigilant and consider defensive strategies.
Common Combinations and Their Implications
- Strong Breadth + Low Volatility: Often seen in bullish phases, where market participation is broad, and price movements are stable.
- Weak Breadth + Rising Volatility: Typically precedes corrections, as fewer stocks participate in rallies, and price swings become more pronounced.
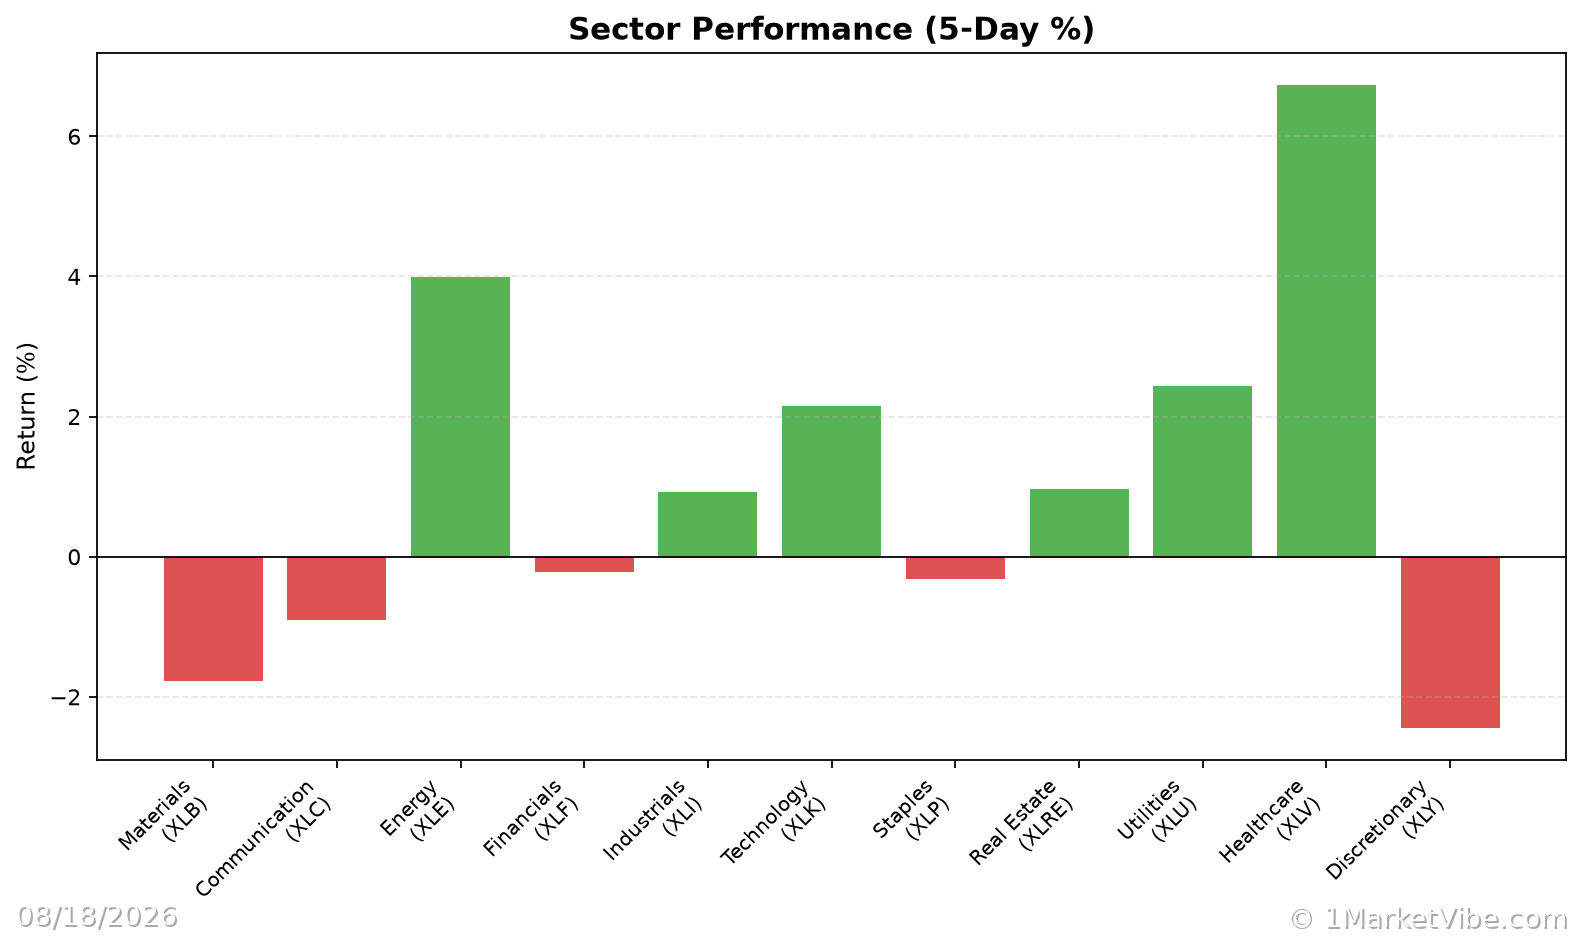
- Defensive Sectors Leading: When defensive sectors outperform, it often signals a risk-off climate, aligning with higher CWI readings.
Real-World Scenarios
Scenario 1: A Topping Market
Imagine a scenario where the broader market index continues to rise, but the percentage of stocks above their 50-DMA declines. This divergence suggests weakening breadth, a common precursor to market tops. In such cases, the CWI may rise, signaling traders to reduce exposure and prepare for potential corrections.
Scenario 2: A New Bull Market Leg
Conversely, consider a market where the % Above 50-DMA surges and remains elevated. This scenario indicates strong market breadth, often seen at the start of a new bull market leg. Here, a lower CWI would support increased risk-taking, provided individual setups align.
Scenario 3: Volatility Spike
In a scenario where ATR% spikes, indicating increased volatility, the CWI would likely accelerate. Traders might feel tempted to exit positions prematurely. However, a more informed approach would involve reassessing risk exposure and potentially hedging against further volatility.
Incorporating CWI Insights into a Trading Process
To effectively use the CWI in a trading process, consider the following guidelines:
- High CWI and Weak Breadth: Emphasize defensive strategies, reduce new risk, and consider hedging.
- Broadening Breadth and Leadership: Be open to adding exposure if setups are favorable.
- Use the Market Dashboard: Leverage the Decision Edge Dashboard to contextualize CWI readings within the broader market regime.
Common Misuses and Misconceptions
Traders often misuse the CWI by:
- Treating it as a Stand-Alone Signal: The CWI should guide risk posture, not serve as a precise entry or exit signal.
- Ignoring Context: Failing to consider sector rotation and broader market conditions can lead to misinterpretation.
- Overreacting to Daily Changes: Focus on sustained trends rather than reacting to short-term fluctuations.
A healthier approach involves integrating CWI insights with other market indicators and maintaining a balanced perspective.
To see these breadth and risk metrics in one place each day, you can use the Decision Edge dashboard at 1marketvibe.com.
DISCLAIMER: This article is for informational purposes only and should not be considered financial advice. Always conduct your own research or consult with a financial advisor before making investment decisions.