Nvidia's Acquisition Enhances Groq: Key Insights for Stakeholders
- Authors

- Name
- MarketVibe Team
- @1marketvibe
Nvidia's Acquisition Enhances Groq: Key Insights for Stakeholders
In the rapidly evolving landscape of technology and artificial intelligence, strategic acquisitions can significantly alter market dynamics. Nvidia's recent acquisition of Groq is one such event, promising to reshape the AI technology sector. This article explores the implications of this acquisition for stakeholders, including employees, investors, and the broader market. We will also discuss how MarketVibe's metrics can provide insights into the market's response and guide stakeholders in navigating these changes.
Acquisition Overview
Nvidia's acquisition of Groq, valued at $20 billion, marks a significant consolidation in the AI technology space. Groq, known for its innovative approach to AI hardware, is expected to enhance Nvidia's capabilities in delivering cutting-edge AI solutions. This acquisition not only strengthens Nvidia's position in the AI market but also sets a precedent for future tech consolidations.
Why Traders Should Care
Understanding the impact of such acquisitions is crucial for traders and investors. It informs decisions about portfolio adjustments, risk management, and sector exposure. By analyzing MarketVibe's metrics, traders can gain insights into market sentiment, volatility, and potential shifts in leadership within the tech sector.
How It Works – Mechanics & Data
To comprehend the market's reaction to Nvidia's acquisition, we can utilize several MarketVibe metrics:
- Crash Warning Index (CWI): This composite index measures risk by evaluating breadth, volatility, and defensive behavior. It helps traders assess the overall market risk environment.
- % Above 50-DMA: This metric indicates the percentage of stocks trading above their 50-day moving average, providing a snapshot of market breadth and trend health.
- ATR% (Average True Range Percentage): This measures volatility relative to price, offering insights into the market's stability or instability.
Mechanics of Key Metrics
- CWI: Constructed from multiple risk dimensions, including breadth (e.g., % Above 50-DMA), volatility (e.g., ATR%), and defensive sector performance. A high CWI suggests elevated market risk.
- % Above 50-DMA: Calculated by dividing the number of stocks above their 50-day moving average by the total number of stocks in the index. A higher percentage indicates stronger market breadth.
- ATR%: Derived from the average true range of price movements, expressed as a percentage of the current price. Higher values indicate increased volatility.
Interpretation – What Different Levels Tend to Mean
CWI Ranges
- Below 3: Low risk, conducive to risk-taking.
- 3 to 6: Moderate risk, suggesting caution.
- Above 6: High risk, indicating potential for market corrections.
% Above 50-DMA
- Above 70%: Strong market trend, bullish sentiment.
- 30% to 70%: Neutral to moderate trend strength.
- Below 30%: Weak trend, potential oversold conditions.
ATR% Regimes
- Below 1%: Low volatility, stable market conditions.
- 1% to 2%: Moderate volatility, potential for choppy trading.
- Above 2%: High volatility, unstable market conditions.
Real-World Scenarios – How This Shows Up in Markets
Scenario 1: A Topping Environment
In a scenario where the market is topping, breadth may deteriorate even as indices grind higher. For example, if the % Above 50-DMA falls below 30% while CWI rises above 6, it suggests weakening internal strength despite surface-level gains. Traders might feel tempted to chase the rally, but a more informed view would emphasize caution and risk management.
Scenario 2: A Strong Bull Leg
During a strong bull market, the % Above 50-DMA might surge above 70% and remain elevated, indicating robust breadth and trend health. In this environment, traders can consider increasing exposure, provided their setups align with market conditions. However, monitoring CWI for any signs of rising risk remains crucial.
Scenario 3: Volatility Spike
A sudden increase in ATR% above 2% signals heightened volatility, often accompanied by a rising CWI. This scenario requires traders to reassess their risk exposure and potentially hedge positions to protect against adverse market moves.
How to Use This Insight in a Process
- When breadth is weak and CWI is high: Emphasize defensive strategies, reduce new risk, and consider hedging.
- When breadth and leadership broaden out: Be open to adding exposure, but ensure setups align with market conditions.
- Use the Market Dashboard: As a high-level regime label, then check internals for confirmation.
Common Misuses & Misconceptions
- Treating metrics as stand-alone signals: Metrics should guide risk posture, not dictate precise entry or exit points.
- Ignoring context: Consider sector rotation and broader market trends when interpreting metrics.
- Overreacting to one-day changes: Focus on sustained trends and patterns rather than daily fluctuations.
To see these breadth and risk metrics in one place each day, you can use the Decision Edge dashboard at 1marketvibe.com.
DISCLAIMER: The information provided is for educational purposes only and should not be considered as financial advice. Always conduct your own research and consult with a financial advisor before making investment decisions.
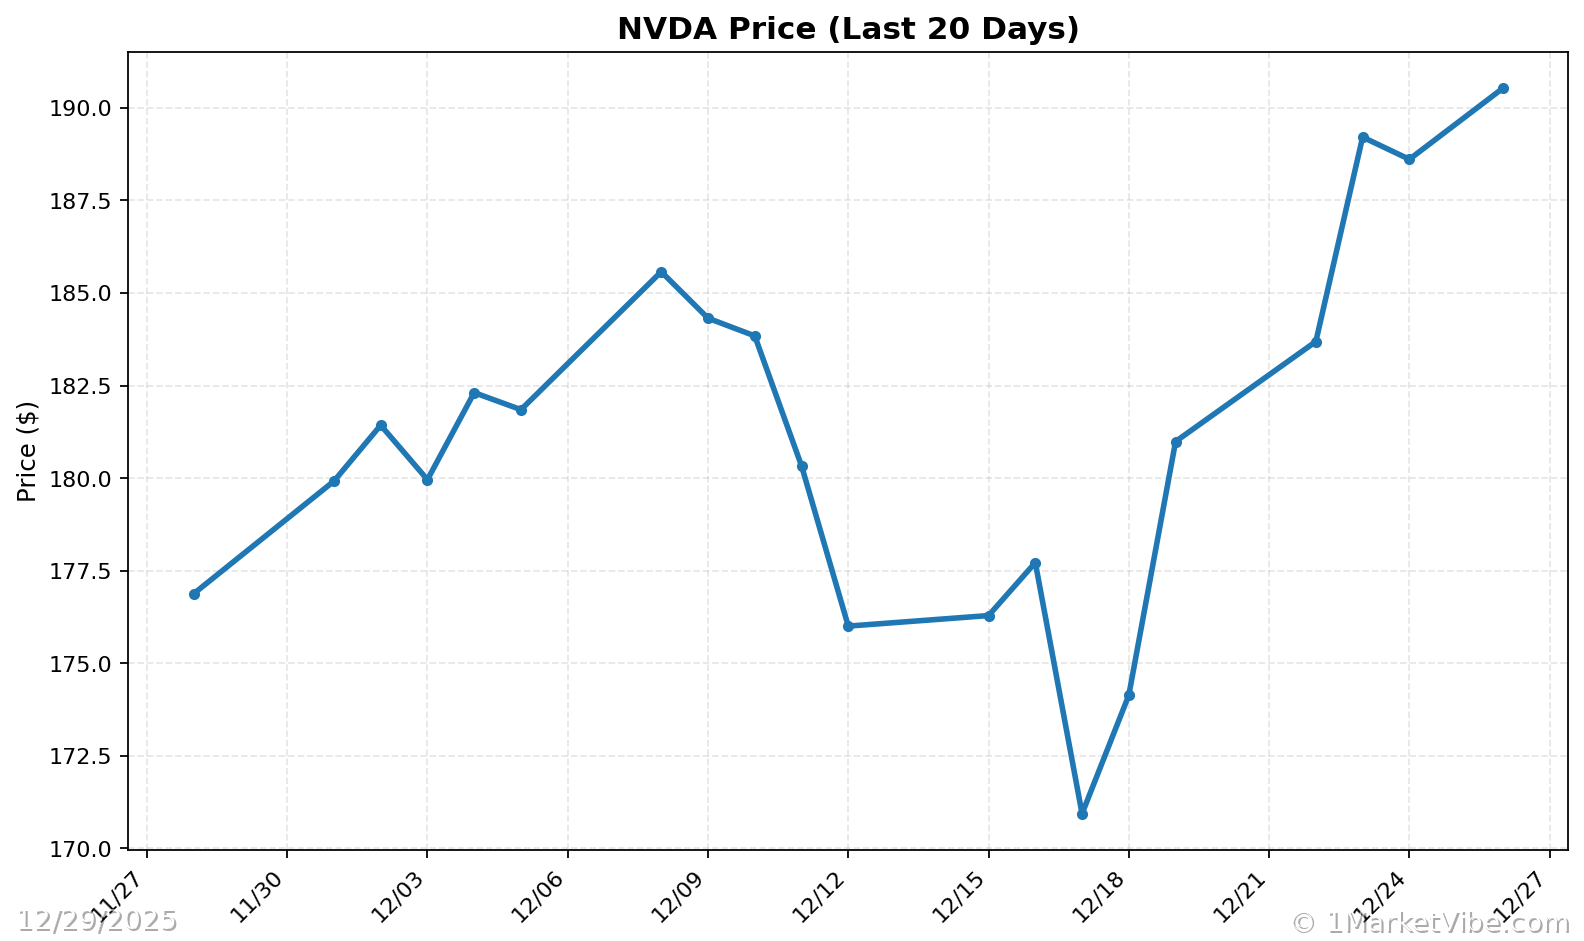
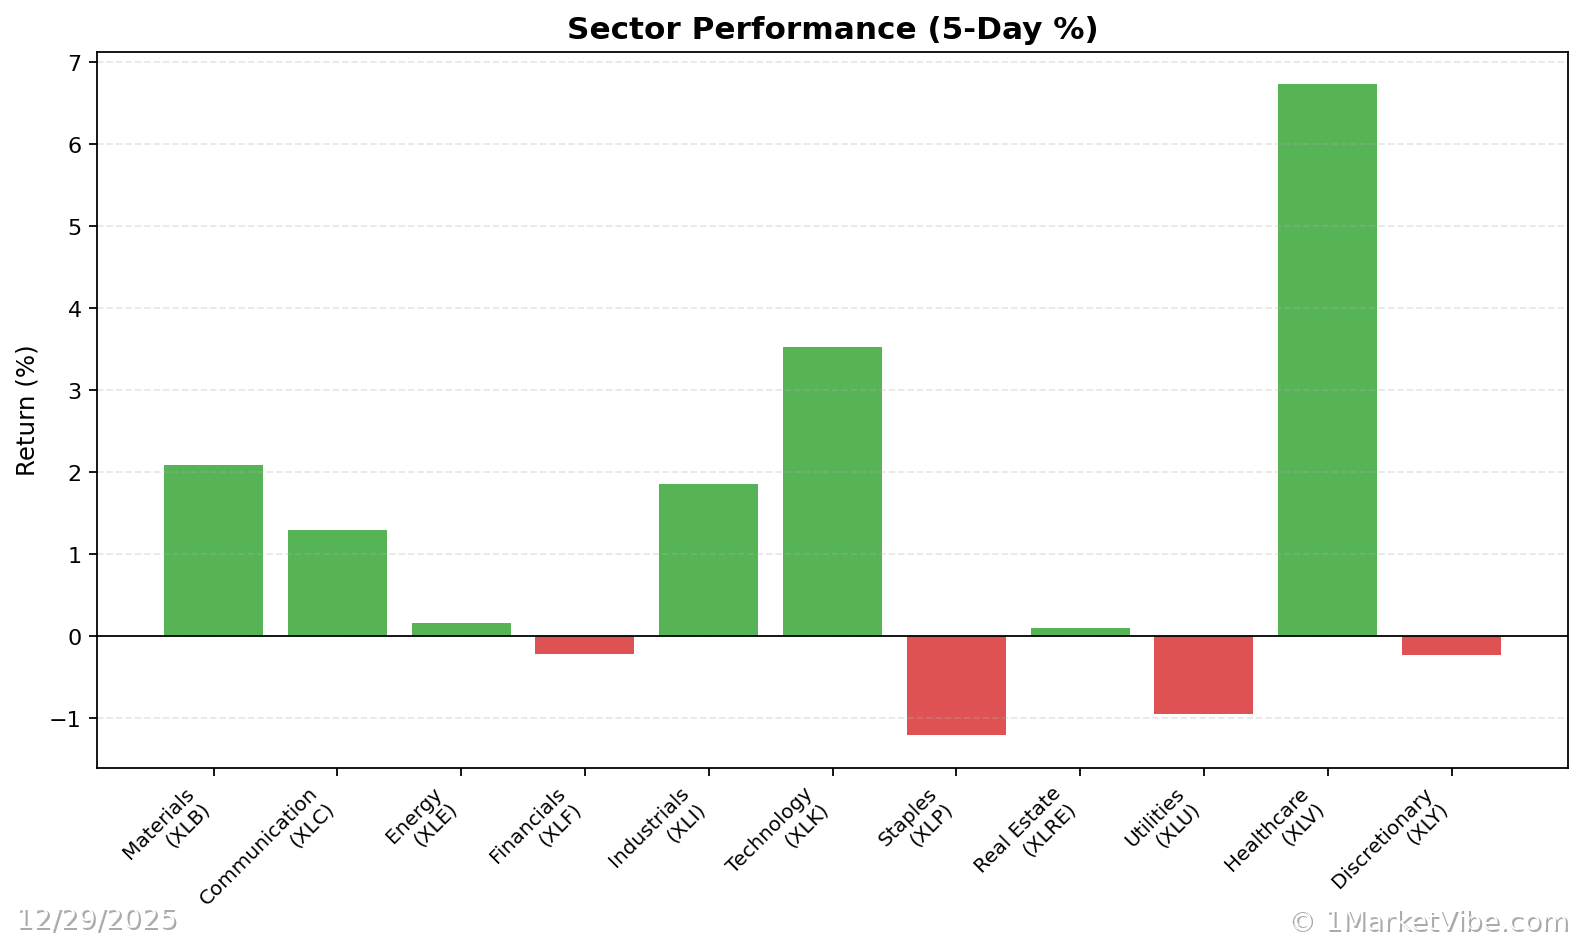
Charts