
Oil Prices Surge as Investors Prepare for Hormuz Blockade Volatility
- Authors

- Name
- MarketVibe Team
- @1marketvibe
Understanding the Impact of the Strait of Hormuz Blockade on Oil Prices and Market Volatility
The recent surge in oil prices, driven by geopolitical tensions and the blockade of the Strait of Hormuz, has significant implications for investors. This article will explore how these developments affect market volatility and how traders can use MarketVibe's metrics, particularly the Crash Warning Index (CWI), to navigate these turbulent times.
Orientation: What Are We Explaining?
The Crash Warning Index (CWI) is a composite indicator that helps traders assess the risk of significant market corrections. It combines various risk dimensions, including market breadth, volatility, and defensive sector behavior. Understanding the CWI is crucial for traders because it informs decisions about risk exposure and helps identify potential blind spots in market analysis. Rather than serving as a magic signal, the CWI is a tool for integrating multiple market signals into a coherent risk management process.
How It Works: Mechanics & Data
The CWI is constructed by aggregating data from several market indicators:
- Breadth: Measures the percentage of stocks trading above their 50-day moving average (50-DMA). A high percentage indicates strong market participation, while a low percentage suggests weakness.
- Volatility: Assessed using the Average True Range percentage (ATR%), which measures price volatility relative to the asset's price. High ATR% indicates increased market turbulence.
- Defensive Behavior: Evaluates the performance of defensive sectors like utilities and consumer staples compared to the broader market.
The CWI moves based on changes in these underlying components. For example, a drop in the percentage of stocks above their 50-DMA or a spike in ATR% can elevate the CWI, signaling increased market risk.
Interpretation: What Different Levels Tend to Mean
- CWI Below 3: Indicates a stable market environment with low risk of correction. Traders might consider maintaining or increasing exposure.
- CWI Between 3 and 6: Suggests moderate risk. Traders should be cautious and consider defensive strategies.
- CWI Above 6: Signals high risk of market correction. Emphasizing risk management and reducing exposure is advisable.
Common combinations include:
- Strong Breadth + Low Volatility: Typically a bullish environment with low CWI.
- Weak Breadth + Rising Volatility: Often precedes market corrections, reflected in a higher CWI.
- Defensive Sectors Leading: When combined with a high CWI, it suggests a shift towards risk aversion.
Real-World Scenarios: How This Shows Up in Markets
Scenario 1: Topping Environment
Imagine a scenario where major indices continue to rise, but the percentage of stocks above their 50-DMA declines. This divergence often signals a topping environment. Traders might feel tempted to chase the rally, but a rising CWI would suggest caution. A more informed approach would involve tightening stop-losses and considering hedging strategies.
Scenario 2: Bull Market Leg
In a strong bull market leg, the % Above 50-DMA surges and remains elevated. The CWI would likely be low, indicating a favorable risk environment. Traders might increase exposure, provided their setups align with broader market trends.
Scenario 3: Volatility Spike
A geopolitical event, such as the Hormuz blockade, can cause a sudden spike in ATR% and elevate the CWI. Traders might panic and make impulsive decisions. However, understanding the CWI's implications would encourage a more measured response, such as reassessing position sizes and implementing protective measures.
How to Use This Insight in a Process
- When Breadth is Weak and CWI is High: Emphasize defensive strategies and reduce new risk exposure. Consider reallocating to sectors less affected by volatility.
- When Breadth and Leadership Broaden Out: Be open to adding exposure if market conditions and individual setups are favorable.
- Use the Market Dashboard: As a high-level regime label, then check internals for confirmation. This approach ensures that broader market conditions align with specific trading strategies.
Common Misuses & Misconceptions
Treating CWI as a Stand-Alone Signal: The CWI should not be used in isolation. It is most effective when combined with other indicators and market context.
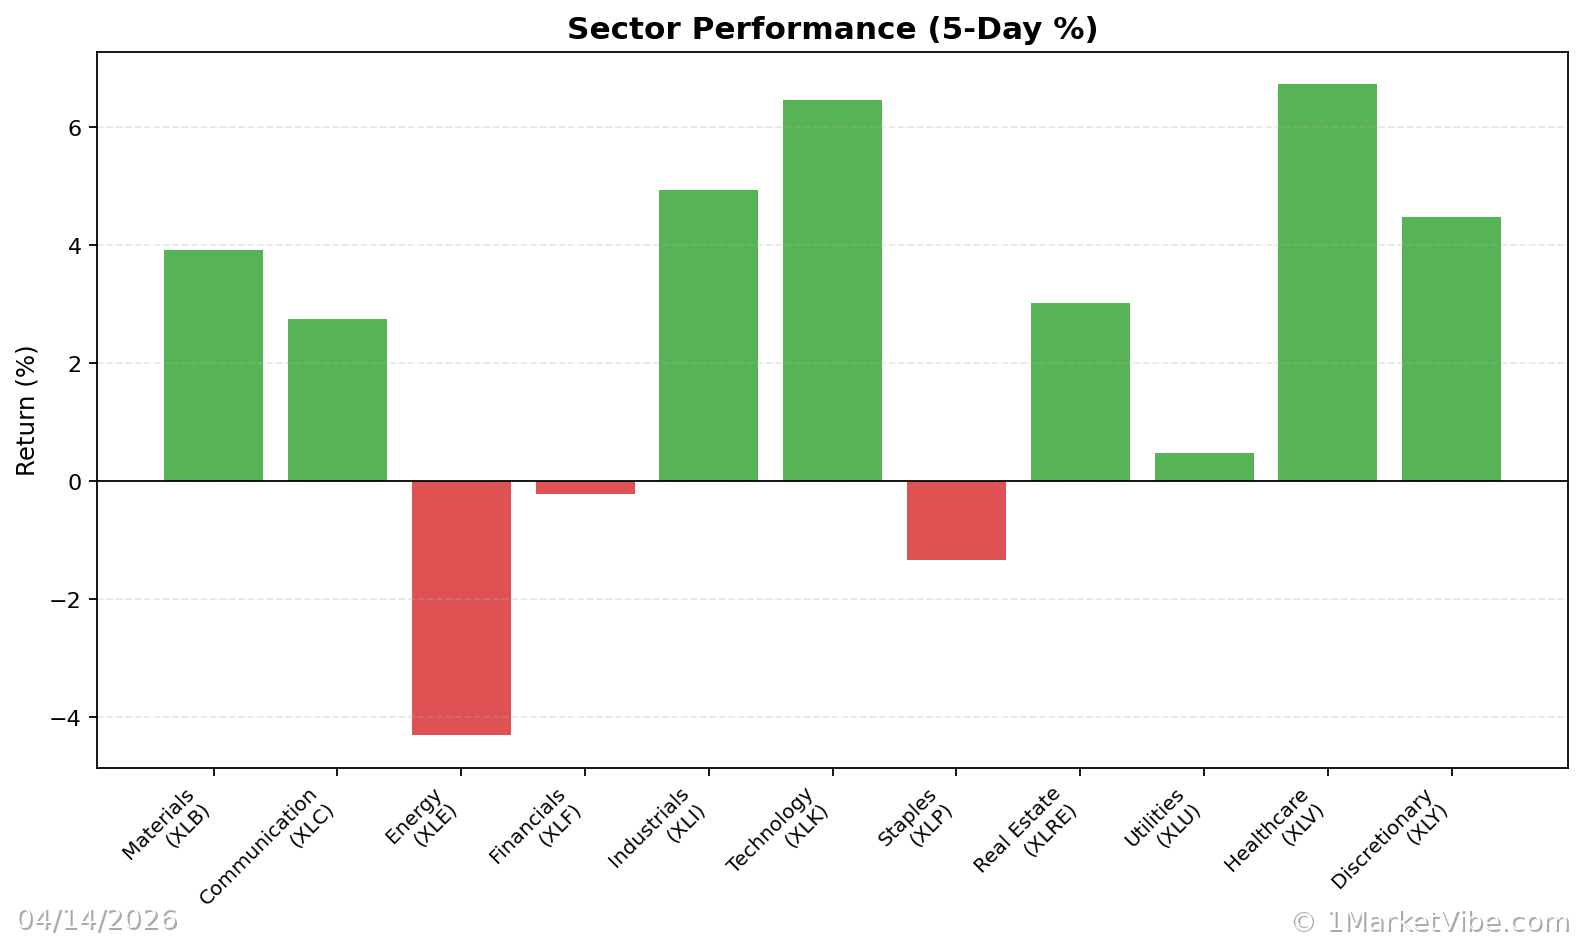
Ignoring Sector Rotation: Understanding which sectors are leading or lagging is crucial. Relying solely on the CWI without considering sector dynamics can lead to missed opportunities.
- Overreacting to One-Day Changes: The CWI is designed to capture broader trends, not daily fluctuations. Traders should focus on sustained changes rather than reacting to short-term noise.
To see these breadth and risk metrics in one place each day, you can use the Decision Edge dashboard at 1marketvibe.com.
Disclaimer: The information provided in this article is for educational purposes only and should not be considered as financial advice. Market conditions can change rapidly, and it is important to conduct your own research and consult with a financial advisor before making investment decisions.