
US-Iran Talks Indicate Potential Oil Price Changes for Investors
- Authors

- Name
- MarketVibe Team
- @1marketvibe
Understanding the Impact of US-Iran Talks on Oil Prices
The ongoing negotiations between the United States and Iran have significant implications for global oil prices, which in turn affect investment decisions across various markets. In this article, we'll explore how these geopolitical developments influence oil prices and how traders can use MarketVibe's metrics to navigate such uncertain conditions.
Why Traders Should Care
Oil prices are a critical component of the global economy, influencing everything from transportation costs to inflation rates. For traders, understanding the dynamics of oil price movements can inform decisions about sector allocations, risk management, and timing of trades. By using MarketVibe's indicators, traders can gain insights into market breadth, volatility, and leadership, which are essential for making informed decisions in the face of geopolitical events.
The Mechanics of Oil Price Movements
Oil prices are primarily driven by supply and demand dynamics. When geopolitical tensions threaten supply, prices tend to rise. Conversely, when peace talks suggest a resolution, prices may fall as supply concerns ease. The recent US-Iran talks have created a volatile environment, with prices initially spiking above $100 per barrel before retreating as hopes for a peace deal emerged.
MarketVibe's Crash Warning Index (CWI) can help traders gauge the risk associated with these price swings. The CWI is a composite metric that considers various risk dimensions, including market breadth, volatility, and defensive behavior. A CWI reading above 6 indicates elevated risk, suggesting that traders should be cautious about taking on new positions.
Interpreting MarketVibe Metrics
% Above 50-DMA: This metric measures the percentage of stocks trading above their 50-day moving average, providing insight into market breadth and trend health. A high percentage indicates strong market breadth, while a low percentage suggests weakness. In the context of oil prices, a decline in this metric could signal that energy stocks are underperforming, reflecting broader market concerns about oil supply disruptions.
ATR% (Average True Range Percentage): ATR% measures volatility relative to price. High ATR% values indicate increased volatility, which is common during geopolitical tensions. When ATR% rises alongside a high CWI, it suggests a turbulent market environment where caution is warranted.
A/D Net (Advance/Decline Net): This indicator tracks the net number of advancing versus declining stocks. A positive A/D Net indicates market strength, while a negative reading signals weakness. During periods of geopolitical uncertainty, a declining A/D Net may reflect investor caution and reduced risk appetite.
Real-World Scenarios
Topping Environment: Imagine a scenario where oil prices surge due to failed US-Iran talks, but the broader market index continues to rise. In this case, the % Above 50-DMA might decline, indicating deteriorating breadth. Traders might feel tempted to chase the rally, but a more informed view would recognize the underlying weakness and adopt a defensive posture.
Bull Leg Surge: Suppose peace talks progress, leading to a significant drop in oil prices and a rally in energy stocks. The % Above 50-DMA could surge, indicating strong breadth and a potential new bull leg. Traders should consider adding exposure, provided their setups align with broader market strength.
Volatility Spike: In a scenario where tensions escalate, causing oil prices to spike, ATR% might increase sharply, and CWI could rise above 6. Traders might feel anxious and react impulsively, but a disciplined approach would involve reducing risk and waiting for volatility to subside before making new commitments.
Incorporating Insights into a Trading Process
To effectively use these insights, traders should:
- Monitor Breadth and Volatility: Use the % Above 50-DMA and ATR% to assess market conditions. Weak breadth and high volatility suggest a defensive stance, while strong breadth and low volatility indicate opportunities for risk-taking.
- Leverage the Market Dashboard: The Decision Edge Dashboard provides a comprehensive view of market regimes. Use it to identify the current climate and adjust your risk posture accordingly.
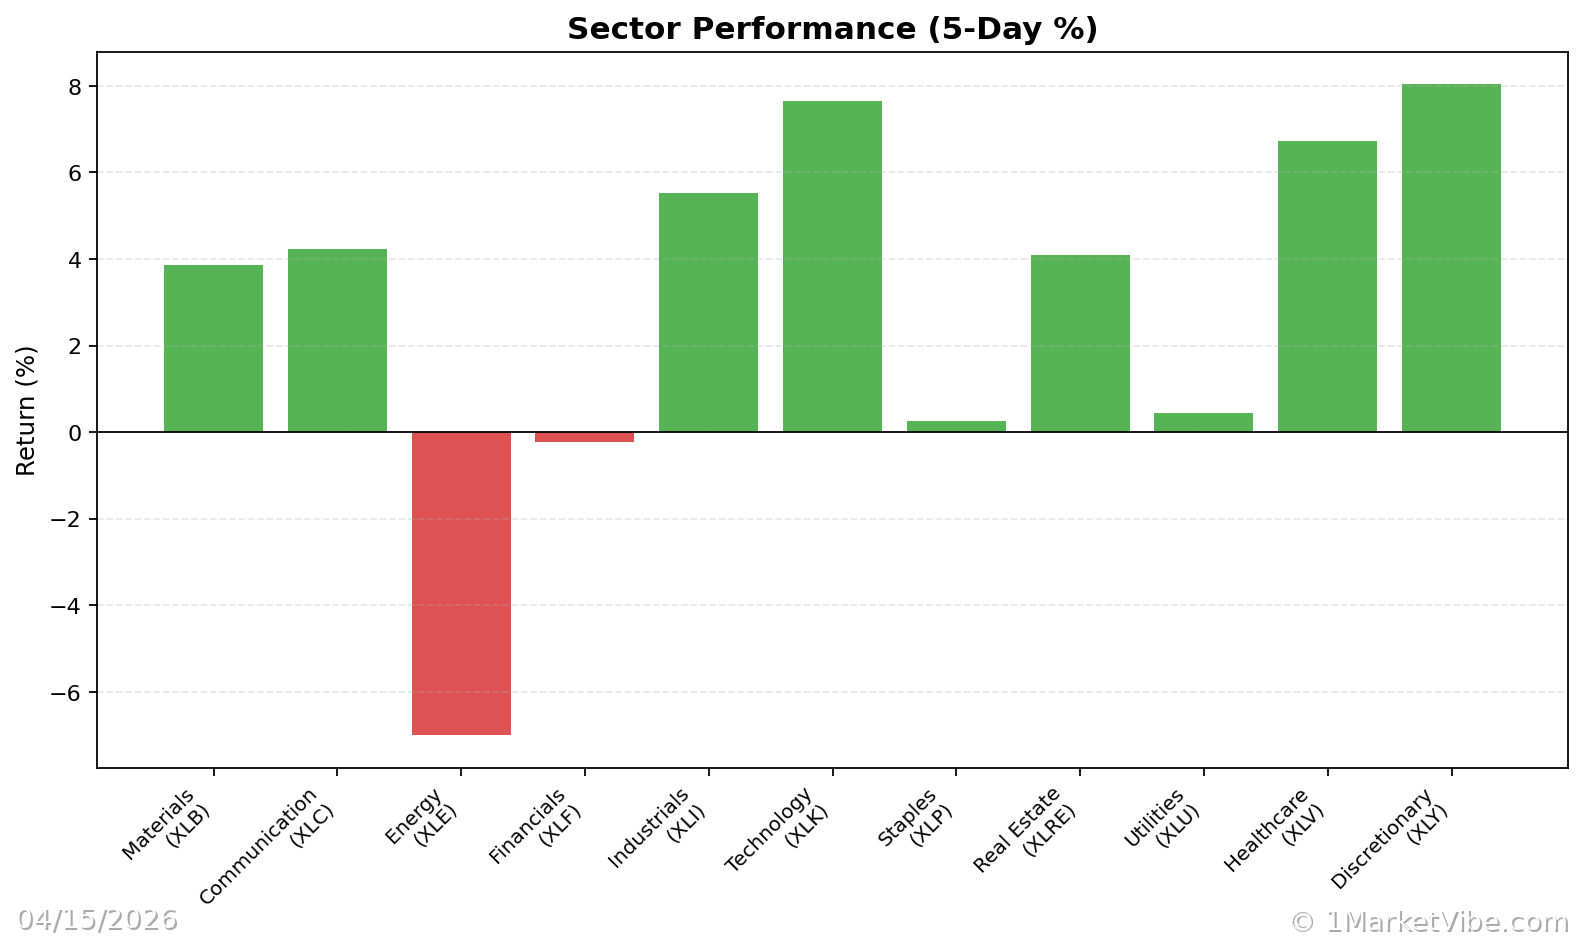
- Align with Sector Leadership: Pay attention to sector scores to understand which areas of the market are leading or lagging. Energy sector performance can be particularly telling during oil price fluctuations.
Common Misuses and Misconceptions
- Standalone Signal Misuse: Traders often treat metrics like the CWI as standalone entry signals. Instead, they should be used as part of a broader risk assessment framework.
- Ignoring Context: Focusing solely on one metric without considering sector rotation or broader market trends can lead to poor decision-making.
- Overreacting to Daily Changes: It's important to avoid overreacting to short-term fluctuations. Instead, focus on sustained trends and confirmatory signals across multiple metrics.
To see these breadth and risk metrics in one place each day, you can use the Decision Edge dashboard at 1marketvibe.com.
Disclaimer: The information provided here is for educational purposes only and should not be considered financial advice. Always conduct your own research before making investment decisions.