
Gold Reaches 1979 Levels: Insights from the CW Index for Investors
- Authors

- Name
- MarketVibe Team
- @1marketvibe
Gold Reaches 1979 Levels: Insights from the CW Index for Investors
Gold has recently reached levels not seen since 1979, marking a significant milestone in the financial markets. This surge in gold prices is not just a headline-grabbing event; it also provides valuable insights into the broader market environment. One of the key tools for understanding these dynamics is the Crash Warning Index (CWI), a composite metric that offers a nuanced view of market risk. In this article, we'll explore how the CWI can help investors navigate the current landscape and make informed decisions.
Orientation – What Are We Explaining?
The Crash Warning Index (CWI) is a composite indicator that aggregates several dimensions of market risk, including breadth, volatility, and defensive behavior. Traders should care about the CWI because it helps identify periods of elevated risk, allowing them to adjust their strategies accordingly. It reduces blind spots by providing a structured view of market conditions, rather than relying on isolated signals. The CWI is not a magic bullet but a tool to enhance a trader's process by informing risk management and exposure decisions.
How It Works – Mechanics & Data
The CWI is constructed by combining various market indicators that measure different aspects of risk:
- Breadth: This includes metrics like the percentage of stocks above their 50-day moving average (% Above 50-DMA) and the Advance/Decline Net (A/D Net), which assess the internal strength of the market.
- Volatility: Measured by the Average True Range percentage (ATR%), which indicates the market's volatility relative to price.
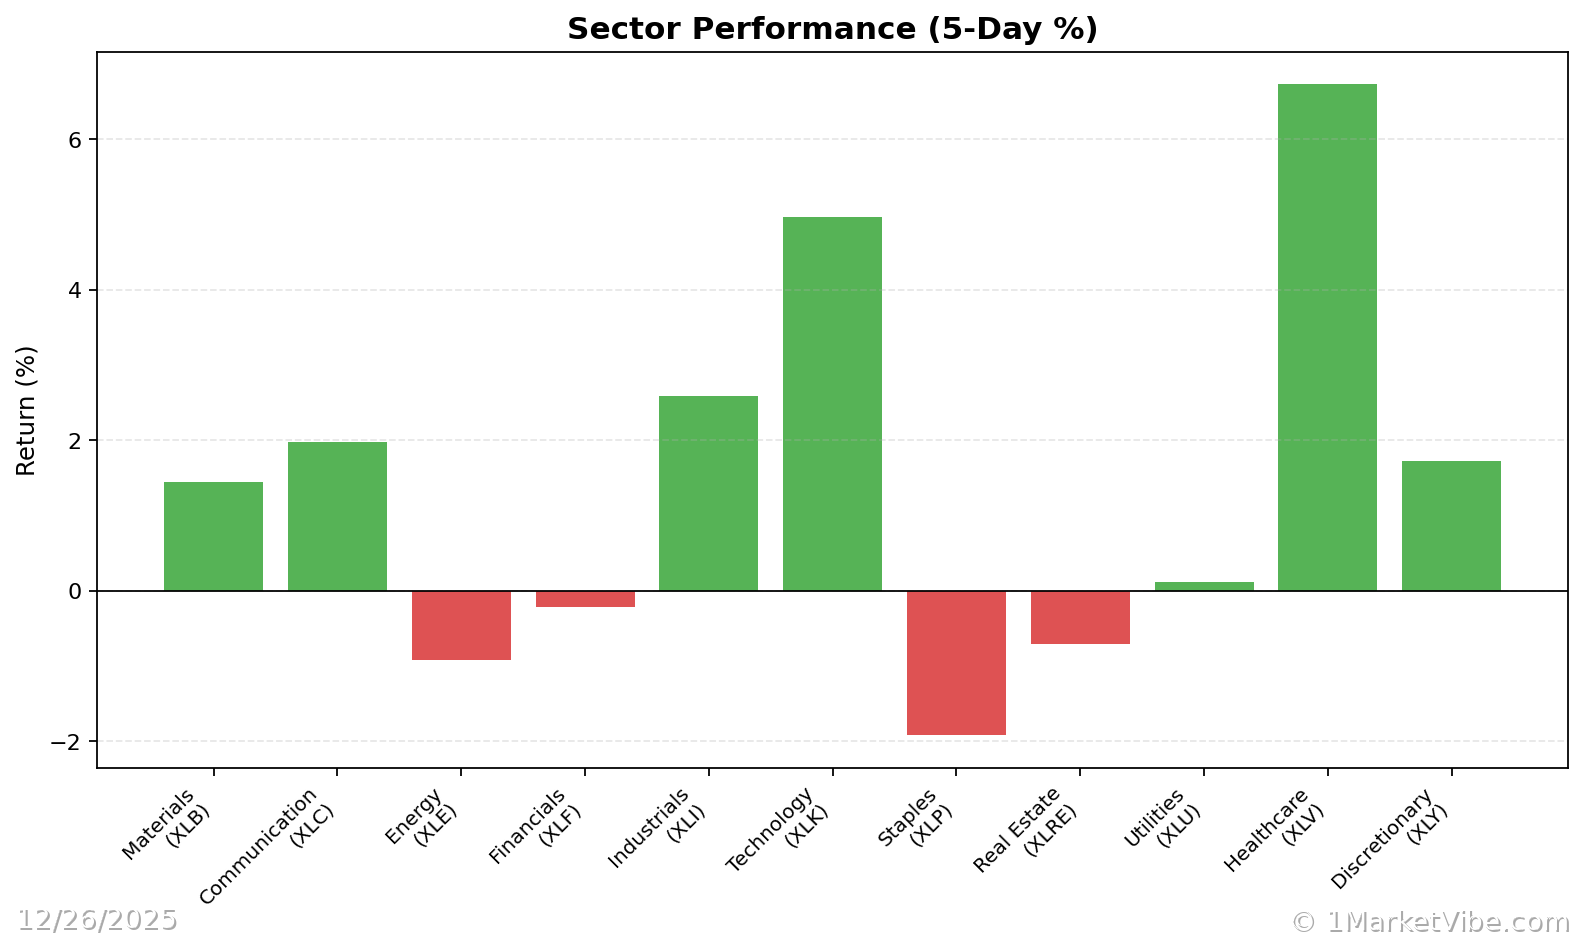
- Defensive Behavior: Observed through sector performance, particularly how defensive sectors like utilities and consumer staples are behaving.
The CWI moves based on changes in these underlying components. For example, a sharp increase in volatility or a deterioration in market breadth can push the CWI higher, signaling increased risk.
Interpretation – What Different Levels Tend to Mean
The CWI provides a range of readings that can guide traders:
- Below 3: Generally indicates a stable market environment with low risk.
- Between 3 and 6: Suggests caution, as risk is moderate and could increase.
- Above 6: Signals elevated risk, where corrections or significant market shifts are more likely.
Common combinations of market conditions include:
- Strong Breadth + Low Volatility: Typically a healthy market environment.
- Weak Breadth + Rising Volatility: Often seen in topping markets or before corrections.
- Defensive Sectors Leading: May indicate a shift towards risk aversion, especially if the CWI is in the warning zone.
Real-World Scenarios – How This Shows Up in Markets
Scenario 1: A Topping Environment
Imagine a scenario where the major indices are hitting new highs, but the % Above 50-DMA is declining, and the A/D Net is negative. The CWI begins to rise above 6, indicating elevated risk. Traders might feel tempted to chase the rally, but a more informed view would suggest caution and possibly reducing exposure.
Scenario 2: A Strong Bull Leg
In a different scenario, the market experiences a broad rally with the % Above 50-DMA surging above 80% and staying elevated. The CWI remains low, under 3, suggesting a stable environment. Here, traders can feel more confident in adding exposure, provided their setups align.
Scenario 3: A Volatility Spike
Consider a sudden increase in ATR%, coupled with a drop in breadth indicators. The CWI spikes above 6, warning of potential turbulence. While some traders might panic, those using the CWI might choose to hedge positions or reduce risk until conditions stabilize.
How to Use This Insight in a Process
To incorporate the CWI into your trading process:
- When Breadth is Weak and CWI is High: Emphasize defense and reduce new risk. This might involve tightening stop losses or scaling back on aggressive positions.
- When Breadth and Leadership Broaden Out: Be more open to adding exposure, but only if your setups are there. Use the CWI as a confirmation tool rather than a sole decision-maker.
- Use the Market Dashboard: As a high-level regime label, then check internals for confirmation. The Decision Edge dashboard can provide a comprehensive view of these metrics.
Common Misuses & Misconceptions
Here are some common pitfalls to avoid when using the CWI:
- Treating it as a Stand-Alone Entry Signal: The CWI should guide your risk posture, not dictate specific trades.
- Ignoring Context: Always consider sector rotation and the broader market environment.
- Overreacting to One-Day Changes: Focus on trends and sustained readings rather than daily fluctuations.
To see these breadth and risk metrics in one place each day, you can use the Decision Edge dashboard at 1marketvibe.com.
Disclaimer: This article is for informational purposes only and does not constitute financial advice. Always conduct your own research or consult a financial advisor before making investment decisions.