Nvidia's $58.3 Billion Profit and Its Implications for Investors in the AI Chip Market
- Authors

- Name
- MarketVibe Team
- @1marketvibe
Nvidia's $58.3 Billion Profit and Its Implications for Investors in the AI Chip Market
In the rapidly evolving landscape of AI technology, Nvidia has emerged as a formidable leader, recently announcing a staggering $58.3 billion profit. This announcement not only highlights Nvidia's dominance in the AI chip market but also raises important considerations for investors navigating this dynamic sector. In this article, we'll explore the implications of Nvidia's financial success, the broader AI chip market context, and how investors can leverage MarketVibe's metrics to make informed decisions.
Financial Highlights
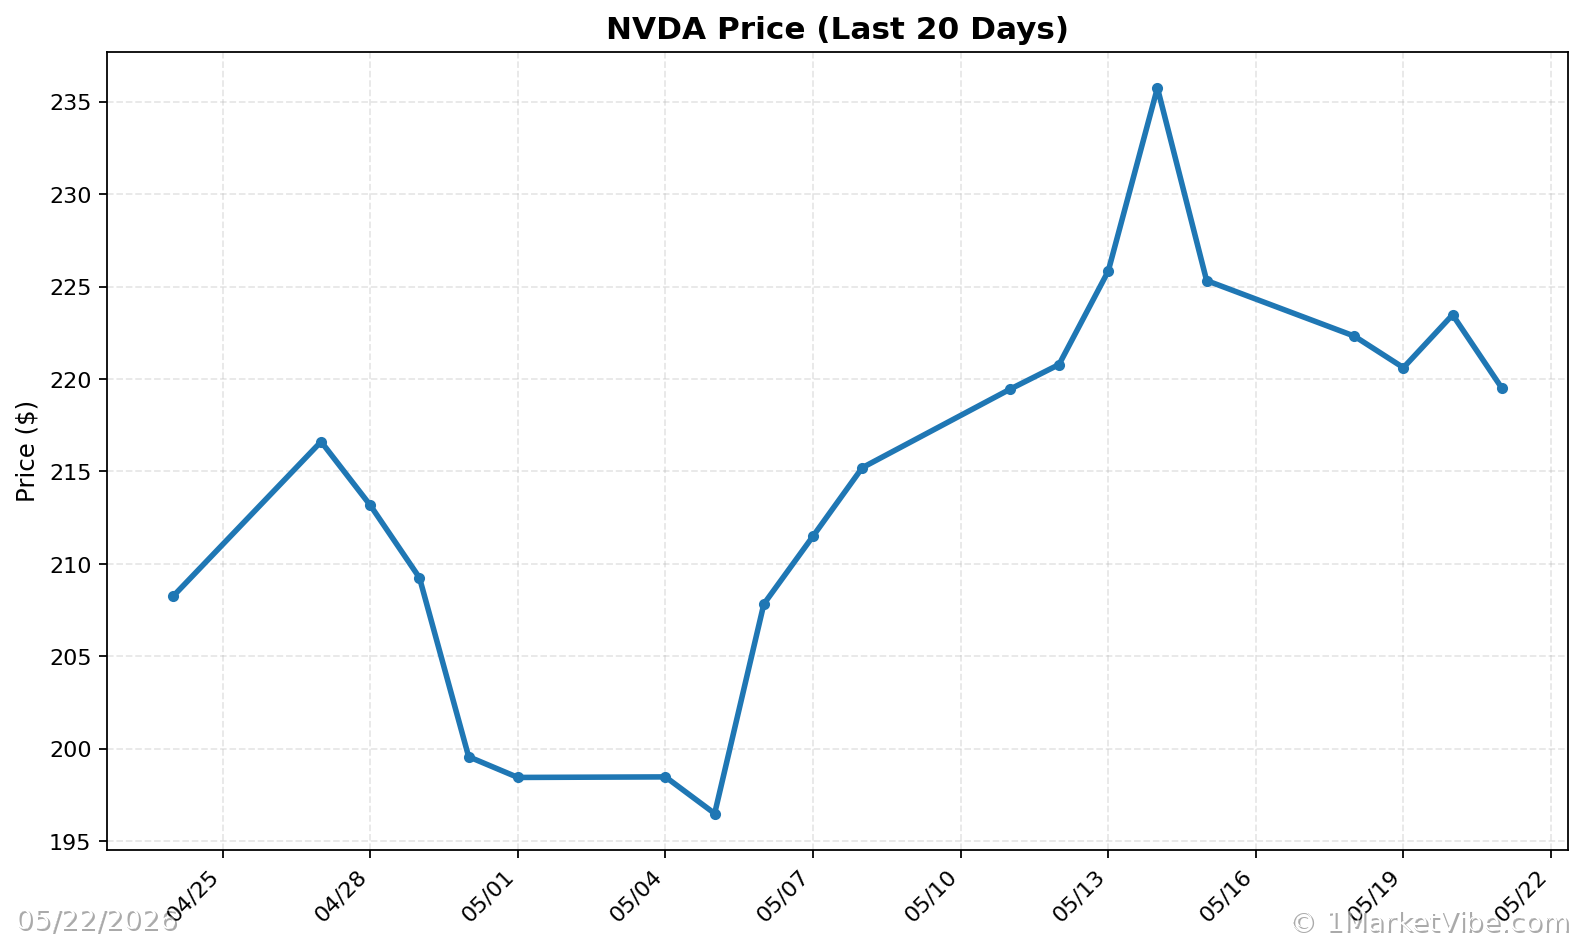
Nvidia's recent financial performance is nothing short of remarkable. The company reported a quarterly profit of $58.3 billion for the February-April period, marking a 37% increase from the previous quarter and a more than 200% rise year-on-year. Revenue also saw a significant boost, reaching $81.6 billion, up 20% from the prior quarter and 85% compared to the same period in 2025. These figures underscore the explosive demand for Nvidia's advanced AI chips, particularly in the data-center business, which experienced a 92% year-on-year revenue surge.
Adding to the excitement, Nvidia announced an $80 billion stock buyback scheme and increased its quarterly cash dividend from $0.01 to $0.25 per share. These moves are designed to reward shareholders and reflect the company's robust cash flow.
Market Position and Competitive Landscape
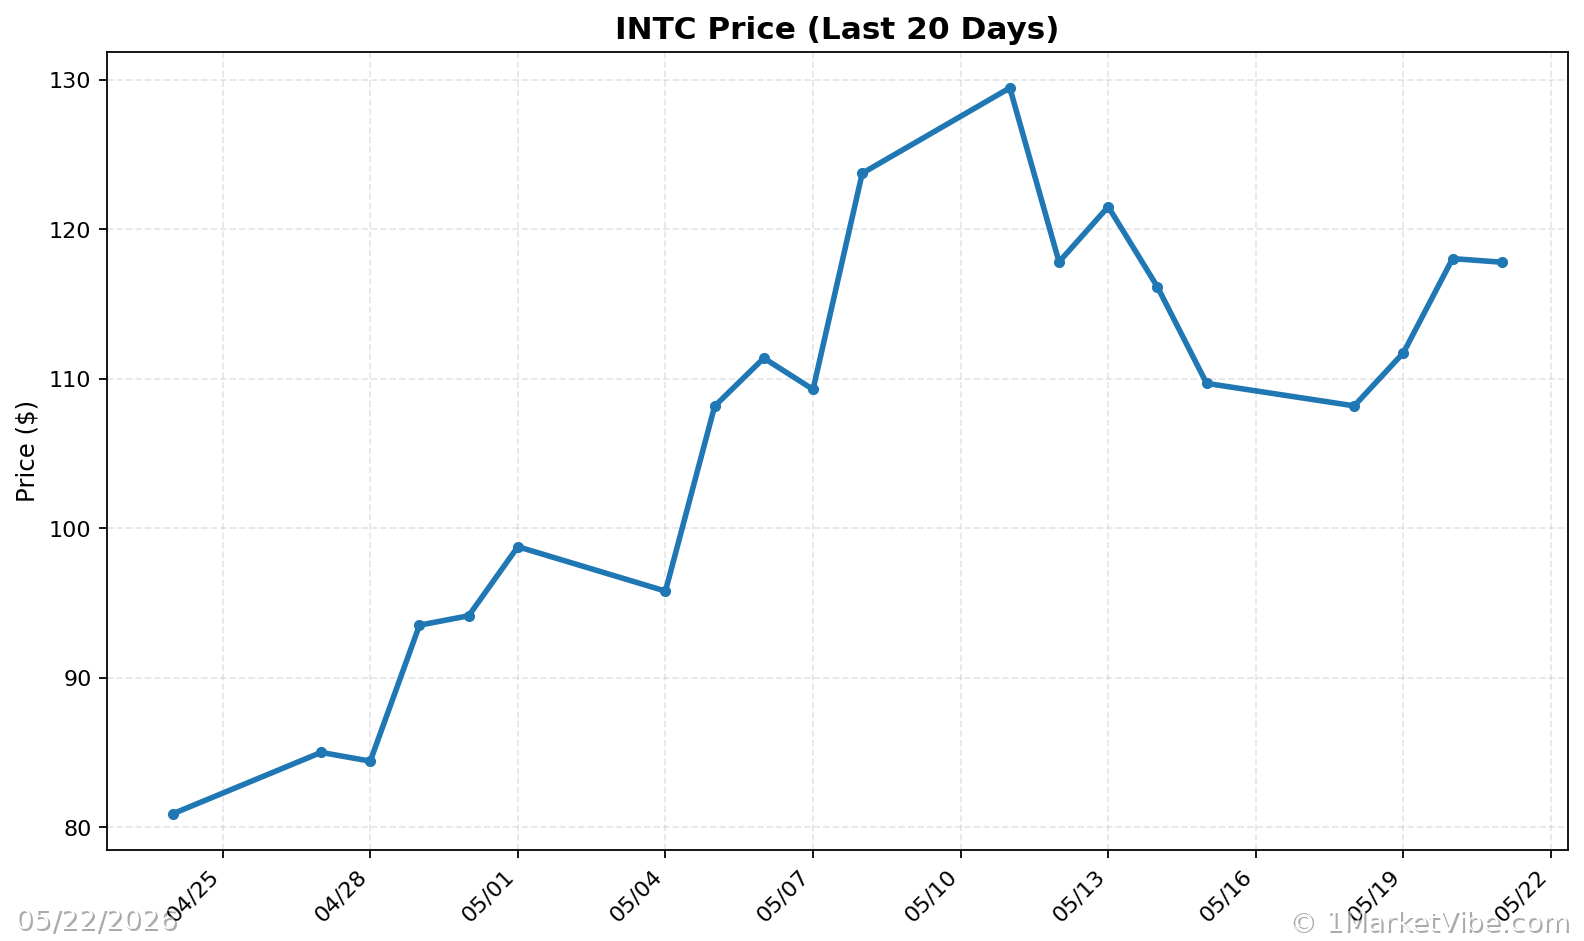
Nvidia's dominance in the AI chip sector is well-established. The company's ability to consistently exceed market expectations has solidified its position as a leader in the industry. However, the AI chip market is not without competition. Companies like AMD, Intel, and emerging players in the AI space are continually innovating, striving to capture a share of this lucrative market.
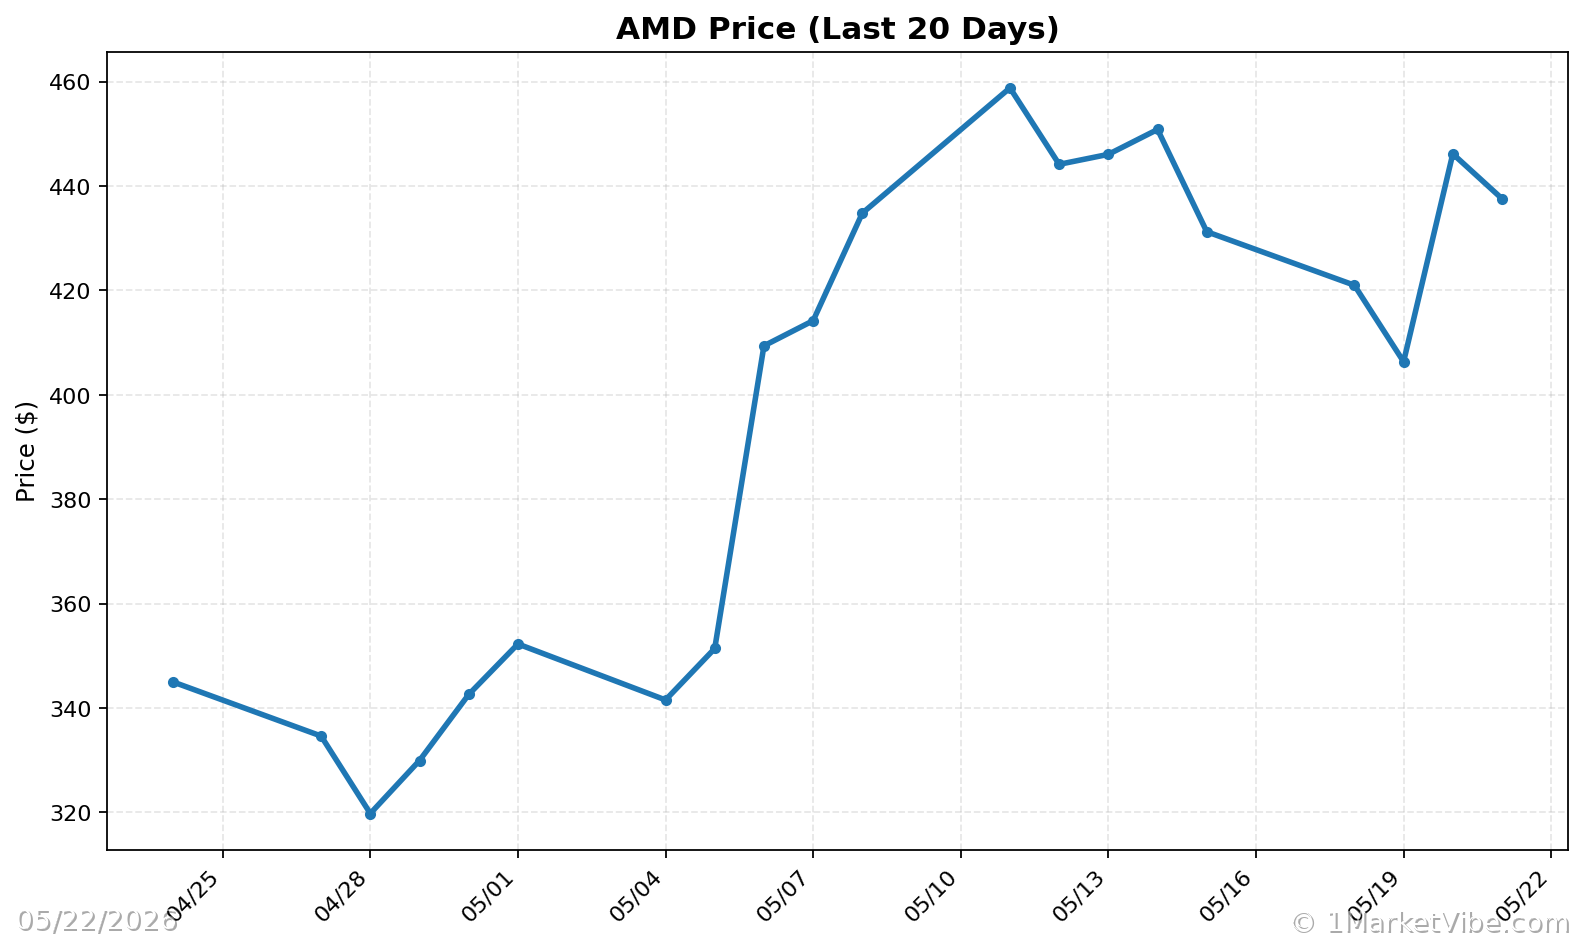
For investors, understanding Nvidia's market position relative to its competitors is crucial. While Nvidia's financial success is impressive, it's important to consider the broader market dynamics and potential challenges from competitors that could impact future growth.
Implications for Investors
Shareholder Benefits
Nvidia's financial strategies, including the stock buyback scheme and dividend increase, are clear indicators of the company's confidence in its future prospects. For shareholders, these actions translate into immediate financial benefits and signal a commitment to returning value to investors.
AI Chip Demand and Future Trends
The demand for AI chips is driven by several factors, including the proliferation of AI applications across industries, advancements in machine learning, and the growing need for data processing capabilities. As AI technology continues to evolve, the demand for high-performance chips is expected to remain strong. Investors should monitor these trends closely, as they will play a critical role in shaping the future of the AI chip market.
Risks and Challenges
Despite Nvidia's impressive performance, potential risks and challenges remain. Market volatility, driven by economic factors or shifts in technology trends, could impact Nvidia's growth trajectory. Additionally, emerging competitors in the AI space pose a threat to Nvidia's market share. Investors should be mindful of these risks and consider them when evaluating their investment strategies.
Leveraging MarketVibe Metrics for Informed Decisions
To navigate the complexities of the AI chip market, investors can utilize MarketVibe's suite of metrics to gain deeper insights into market conditions. Here's how some of these metrics can be applied:
Crash Warning Index (CWI)
The Crash Warning Index (CWI) is a composite measure that assesses various risk dimensions, including breadth, volatility, and defensive behavior. When CWI is elevated, it suggests heightened market risk, prompting investors to adopt a more defensive posture. Monitoring CWI can help investors anticipate potential market corrections and adjust their strategies accordingly.
% Above 50-DMA
The % Above 50-DMA metric provides a snapshot of market breadth and trend health. A high percentage indicates strong market breadth, while a low percentage suggests weakness or oversold conditions. Investors can use this metric to gauge the overall market sentiment and identify potential entry or exit points.
ATR% (Average True Range Percentage)
ATR% measures market volatility relative to price. Low ATR% values often correspond to stable, trending markets, while high ATR% values indicate increased volatility and potential instability. By tracking ATR%, investors can better understand the current volatility regime and adjust their risk exposure accordingly.
Real-World Scenarios
Scenario 1: Strong Bull Market
Imagine a scenario where the % Above 50-DMA surges, indicating robust market breadth, while ATR% remains low, suggesting a stable trending environment. In such a scenario, investors might feel confident about increasing their exposure to AI chip stocks, including Nvidia, as the market conditions are favorable for growth.
Scenario 2: Volatility Spike
Consider a situation where ATR% jumps significantly, signaling a spike in market volatility, while CWI also rises, indicating increased risk. In this case, investors might be tempted to panic and sell off their holdings. However, a more informed approach would involve reassessing risk exposure, potentially hedging positions, and waiting for volatility to subside before making drastic portfolio changes.
Scenario 3: Market Correction
In a market correction scenario, where % Above 50-DMA falls below a critical threshold and CWI remains elevated, investors should prioritize capital preservation. This might involve reducing exposure to high-risk assets and focusing on defensive sectors until market conditions stabilize.
Practical Process Guidance
To effectively incorporate these insights into an investment process, consider the following guidelines:
- Emphasize Defense When Necessary: When breadth is weak and CWI is high, prioritize defensive strategies and reduce new risk exposure.
- Broaden Exposure in Favorable Conditions: When breadth and leadership expand, consider increasing exposure, provided your setups align with market conditions.
- Use the Market Dashboard for Context: Leverage MarketVibe's Market Dashboard to gain a high-level view of market regimes and confirm internal metrics before making decisions.
Common Misuses and Misconceptions
Investors often make the mistake of treating individual metrics as stand-alone signals. Here are some common misuses and healthier alternatives:
- Overreliance on Single Metrics: Avoid using a single metric as the sole basis for investment decisions. Instead, consider the broader context and multiple indicators.
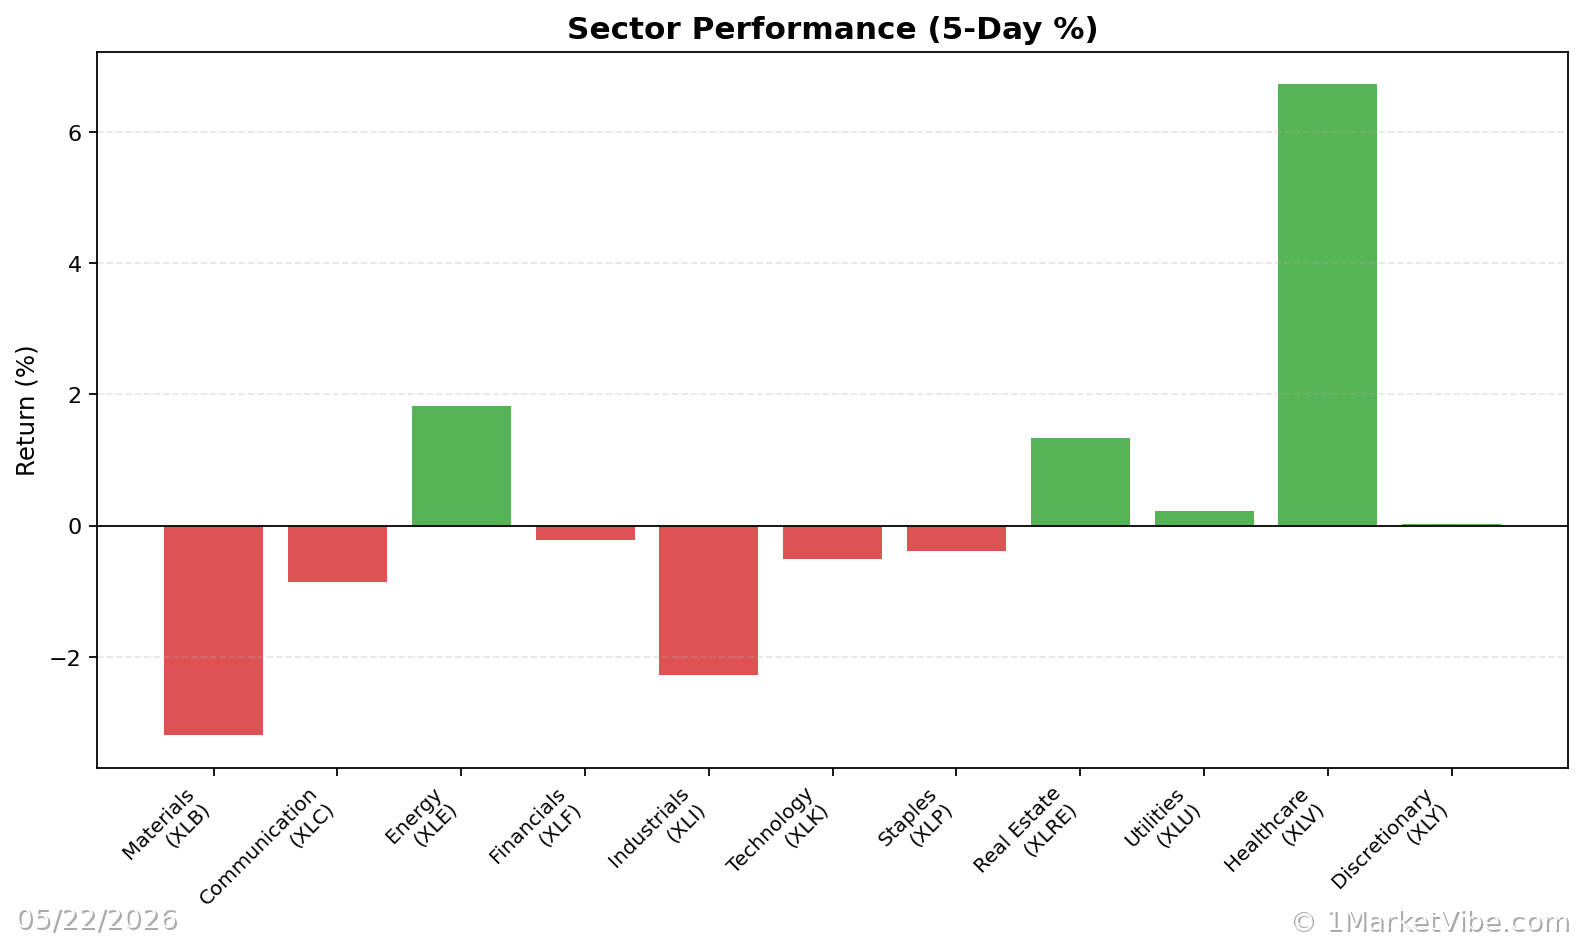
- Ignoring Sector Rotation: Pay attention to sector rotation and how it impacts overall market dynamics. Different sectors may respond differently to the same market conditions.
- Overreacting to Short-Term Changes: Resist the urge to make impulsive decisions based on one-day metric changes. Focus on longer-term trends and patterns.
To see these breadth and risk metrics in one place each day, you can use the Decision Edge dashboard at 1marketvibe.com.
This article is for informational purposes only and does not constitute financial advice. Always conduct your own research or consult with a financial advisor before making investment decisions.
Charts