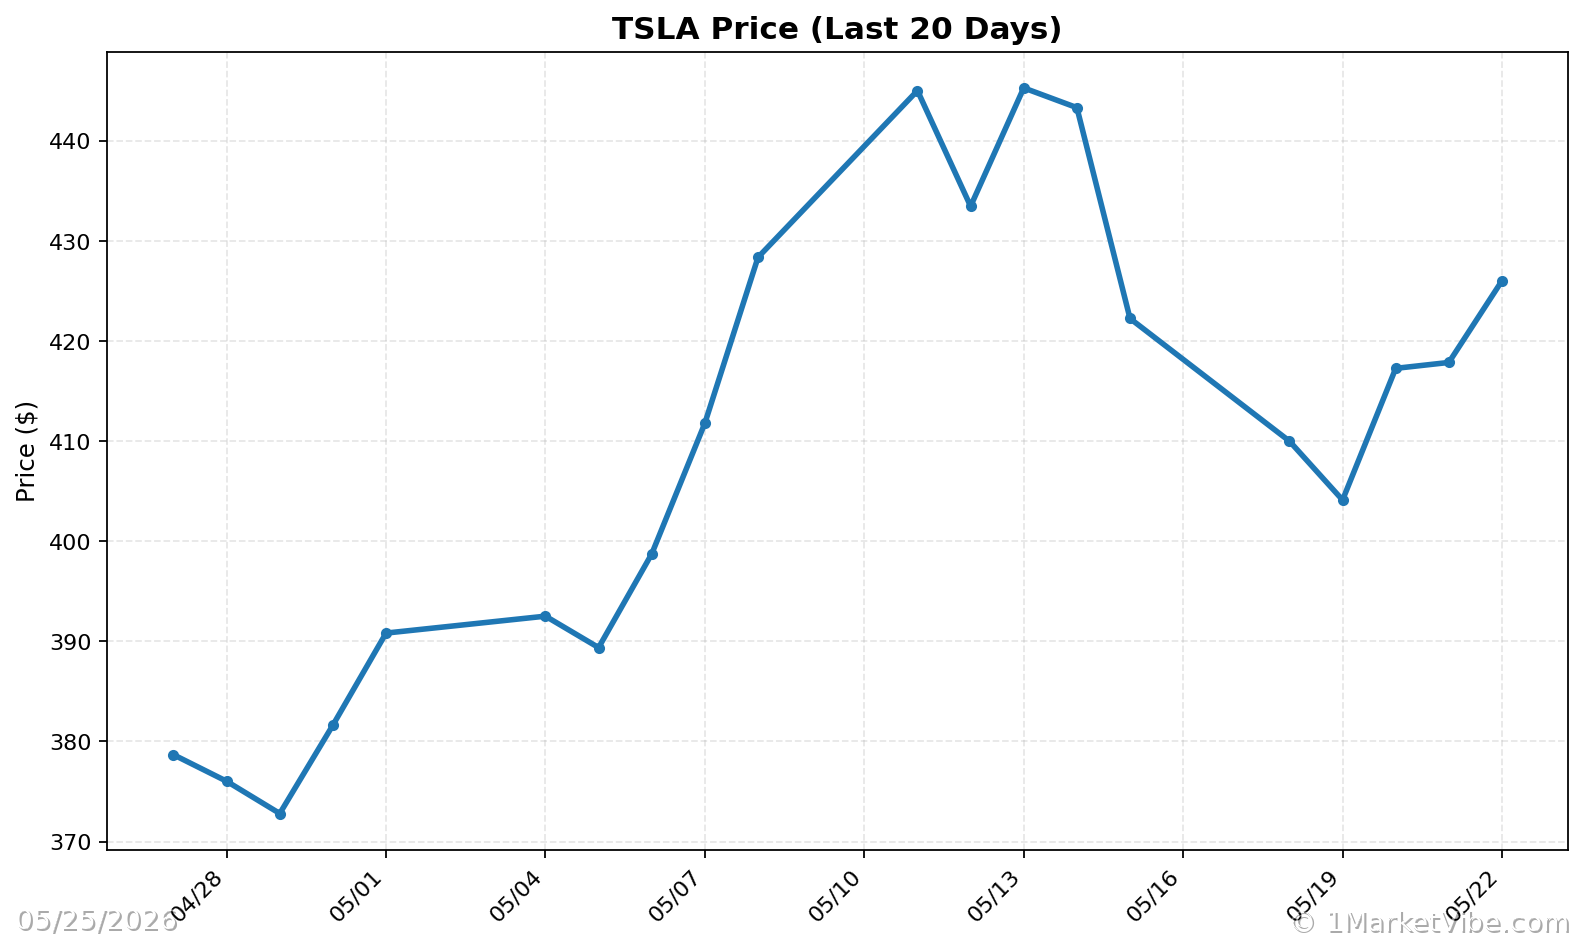
Market Rebound as Tesla and AI Stocks Reach Key Buy Levels
- Authors

- Name
- MarketVibe Team
- @1marketvibe
Market Rebound as Tesla and AI Stocks Reach Key Buy Levels
In the ever-evolving landscape of financial markets, understanding the underlying mechanics and signals can significantly enhance a trader's decision-making process. Today, we delve into the current market rebound, spotlighting Tesla and AI stocks reaching key buy levels. This article will guide you through the metrics and indicators that inform these opportunities and how to integrate them into a structured trading process.
1. Orientation – What Are We Explaining?
The primary focus here is on the % Above 50-DMA (50-Day Moving Average) and its implications for market breadth and trend health. This metric is crucial for traders because it provides insight into the overall market trend and the health of individual stocks within that trend. By understanding the % Above 50-DMA, traders can make informed decisions about entry and exit points, manage risk more effectively, and avoid common pitfalls such as chasing momentum without confirmation.
2. How It Works – Mechanics & Data
Breadth and Trend Health
The % Above 50-DMA measures the percentage of stocks within a given universe (such as the S&P 500) that are trading above their 50-day moving averages. Conceptually, this is a breadth indicator, showing how many stocks are participating in a given market trend. A high percentage indicates a strong, broad-based trend, while a low percentage suggests weakness or a narrow rally.
Example Calculation:
- If 300 out of 500 stocks in the S&P 500 are above their 50-DMA, the % Above 50-DMA is 60%.
Day-to-Day Movement
This metric can fluctuate based on daily price movements of individual stocks. For instance, if a significant number of stocks break above or fall below their 50-DMA, the overall percentage will adjust accordingly. This can be influenced by earnings reports, macroeconomic news, or sector rotations.
3. Interpretation – What Different Levels Tend to Mean
Ranges and Regimes
- Above 70%: Indicates a robust market trend with broad participation. This is often seen in strong bull markets.
- 50% to 70%: Suggests a healthy trend but with potential for consolidation or pullbacks.
- Below 50%: Typically signals a weak or oversold market, where caution is warranted.
Common Combinations
- Strong Breadth + Low Volatility: Ideal for trend-following strategies, indicating stable market conditions.
- Weak Breadth + Rising Volatility: Suggests potential market instability, often preceding corrections.
4. Real-World Scenarios – How This Shows Up in Markets
Scenario 1: A Strong Bull Leg
Imagine a scenario where the % Above 50-DMA surges to 75% and remains elevated. This suggests a strong bull market with widespread participation. Traders might be tempted to increase exposure, but a more informed approach would involve confirming setups and managing risk by monitoring volatility levels.
Scenario 2: A Topping Environment
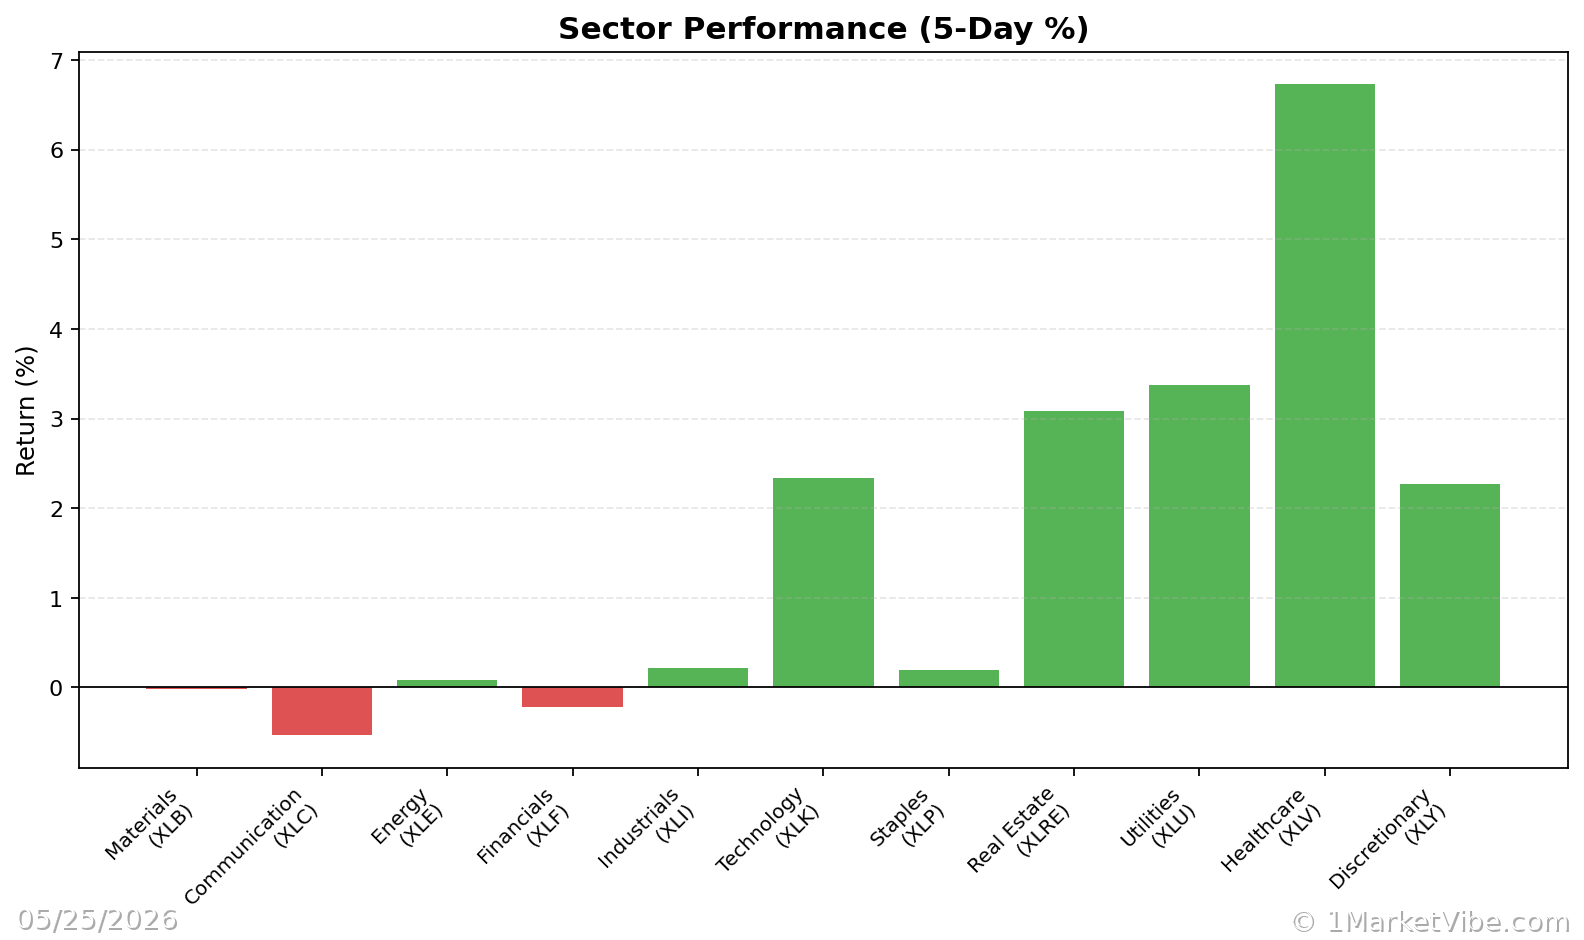
In a topping environment, the index might continue to rise while the % Above 50-DMA declines to 45%. This divergence indicates weakening breadth, a potential warning sign of an impending correction. Traders should consider tightening stops and reducing exposure to high-beta stocks.
Scenario 3: Volatility Spike
A sudden increase in ATR% (Average True Range Percentage) alongside a drop in % Above 50-DMA to 40% could indicate a volatility spike. This environment favors defensive strategies and highlights the importance of monitoring the Crash Warning Index (CWI) for elevated risk levels.
5. How to Use This Insight in a Process
Practical Guidelines
- Weak Breadth and High CWI: Emphasize defensive strategies, reduce new risk, and consider hedging positions.
- Broadening Breadth and Leadership: Be open to adding exposure, provided your setups align with market conditions.
- Use the Market Dashboard: As a high-level regime label, then verify with internal metrics for confirmation.
These guidelines help traders maintain a balanced risk posture and set realistic expectations without relying on precise timing.
6. Common Misuses & Misconceptions
Misuse 1: Stand-Alone Entry Signal
Traders often mistake % Above 50-DMA as a standalone entry signal. Instead, it should be part of a broader analysis, including sector rotation and volatility metrics.
Misuse 2: Ignoring Context
Ignoring the broader market context, such as sector performance and macroeconomic factors, can lead to misinterpretation. Always consider the complete picture.
Misuse 3: Overreacting to One-Day Changes
Reacting to daily fluctuations can lead to whipsaw trades. Focus on sustained trends and confirmation from multiple indicators.
To see these breadth and risk metrics in one place each day, you can use the Decision Edge dashboard at 1marketvibe.com.
Disclaimer: This article is for informational purposes only and should not be considered financial advice. Always conduct your own research or consult a financial advisor before making investment decisions.
Charts