

Meta's $18 Billion Deal to Transform Children's Social Media Experience
- Authors

- Name
- MarketVibe Team
- @1marketvibe
Understanding Meta's $18 Billion Deal and Its Market Implications
Meta's recent $18 billion settlement marks a significant shift in how social media platforms, particularly those targeting children, will operate. This development is not just a legal or corporate milestone; it has broader implications for market dynamics, regulatory landscapes, and investor sentiment. In this article, we'll explore these aspects and how they relate to MarketVibe's metrics, helping traders understand the underlying market structure and potential impacts on their trading processes.
Settlement Details and Market Relevance
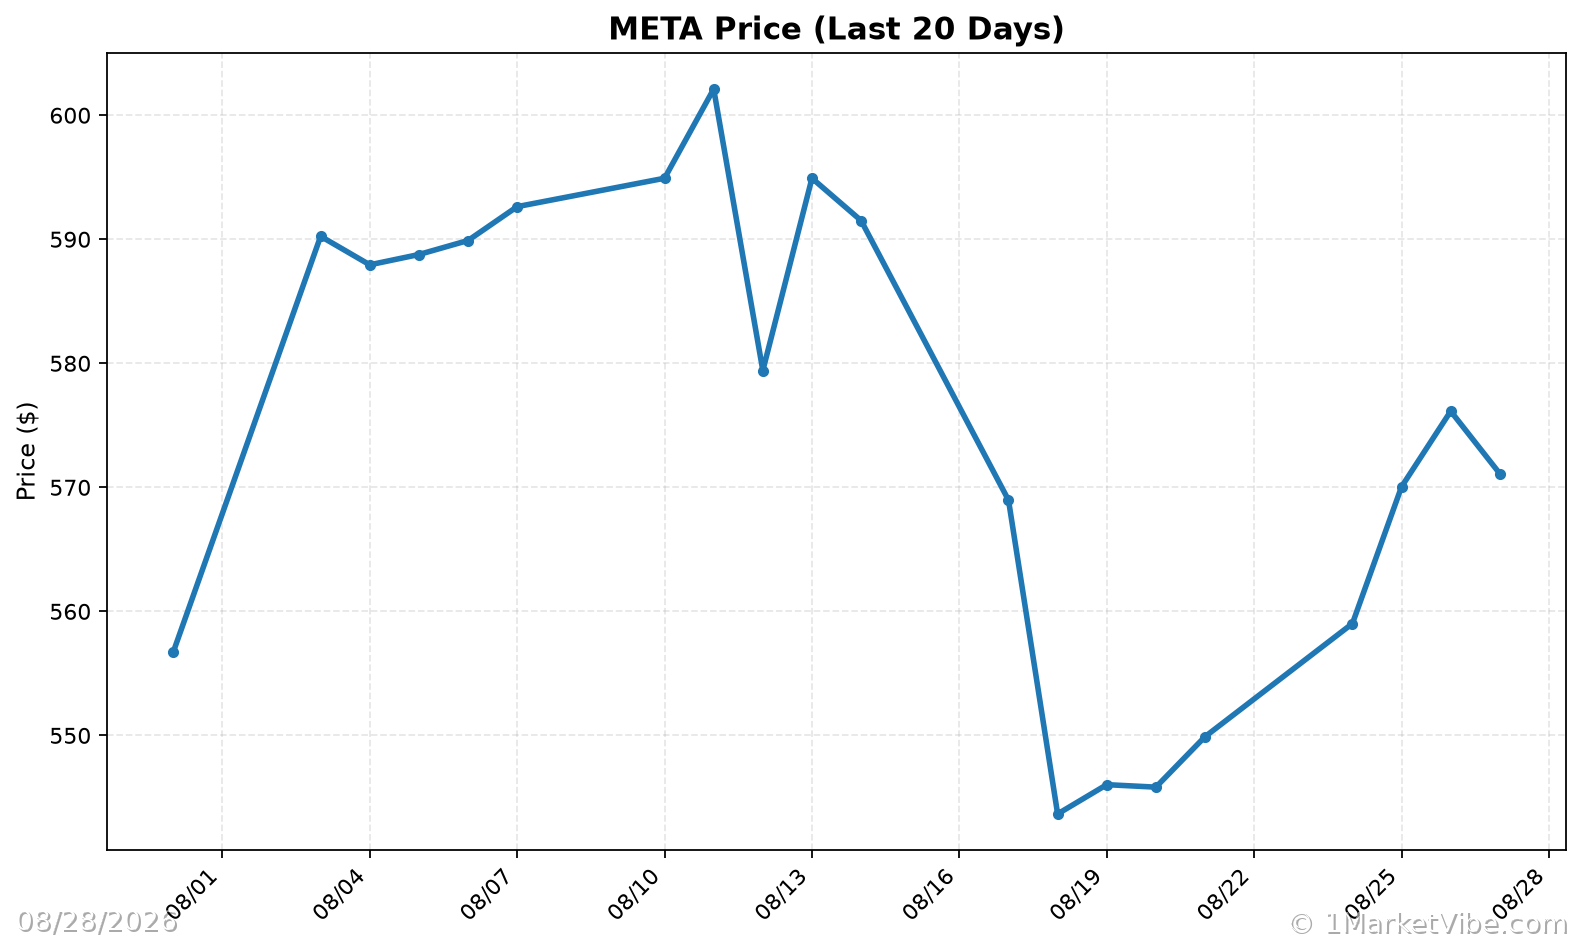
Meta's settlement comes in response to accusations that its platforms, Facebook and Instagram, were designed to be addictive, particularly to younger users. The settlement mandates the introduction of new safety features, such as night curfews and two-hour usage limits for users under 18. This move is part of a broader regulatory trend that could influence market dynamics in the tech sector.
Why Traders Should Care
Understanding the implications of such regulatory changes is crucial for traders. These developments can affect investor sentiment, sector performance, and ultimately, market risk conditions. By integrating insights from MarketVibe's metrics, traders can better navigate these changes and adjust their strategies accordingly.
MarketVibe Metrics: A Framework for Understanding
To grasp the market implications of Meta's settlement, we can leverage several MarketVibe metrics:
Crash Warning Index (CWI)
CWI is a composite metric that assesses market risk by considering factors like breadth, volatility, and defensive behavior. A high CWI suggests elevated risk and potential market corrections. In the context of Meta's settlement, increased regulatory scrutiny could lead to heightened market volatility, impacting the CWI.
% Above 50-DMA
This metric measures the percentage of stocks trading above their 50-day moving average, providing insight into market breadth and trend health. Regulatory changes affecting major tech companies like Meta could influence this metric by altering investor confidence and sector performance.
ATR% (Average True Range Percentage)
ATR% measures market volatility relative to price. Regulatory developments can lead to increased volatility, impacting ATR% levels. A rising ATR% in the tech sector could indicate growing uncertainty and risk.
Interpreting Market Conditions
Regulatory Impact on Market Metrics
CWI and Regulatory Changes: If regulatory actions against tech companies increase, we might see a rise in CWI, indicating higher market risk. Traders should be cautious and consider defensive strategies.
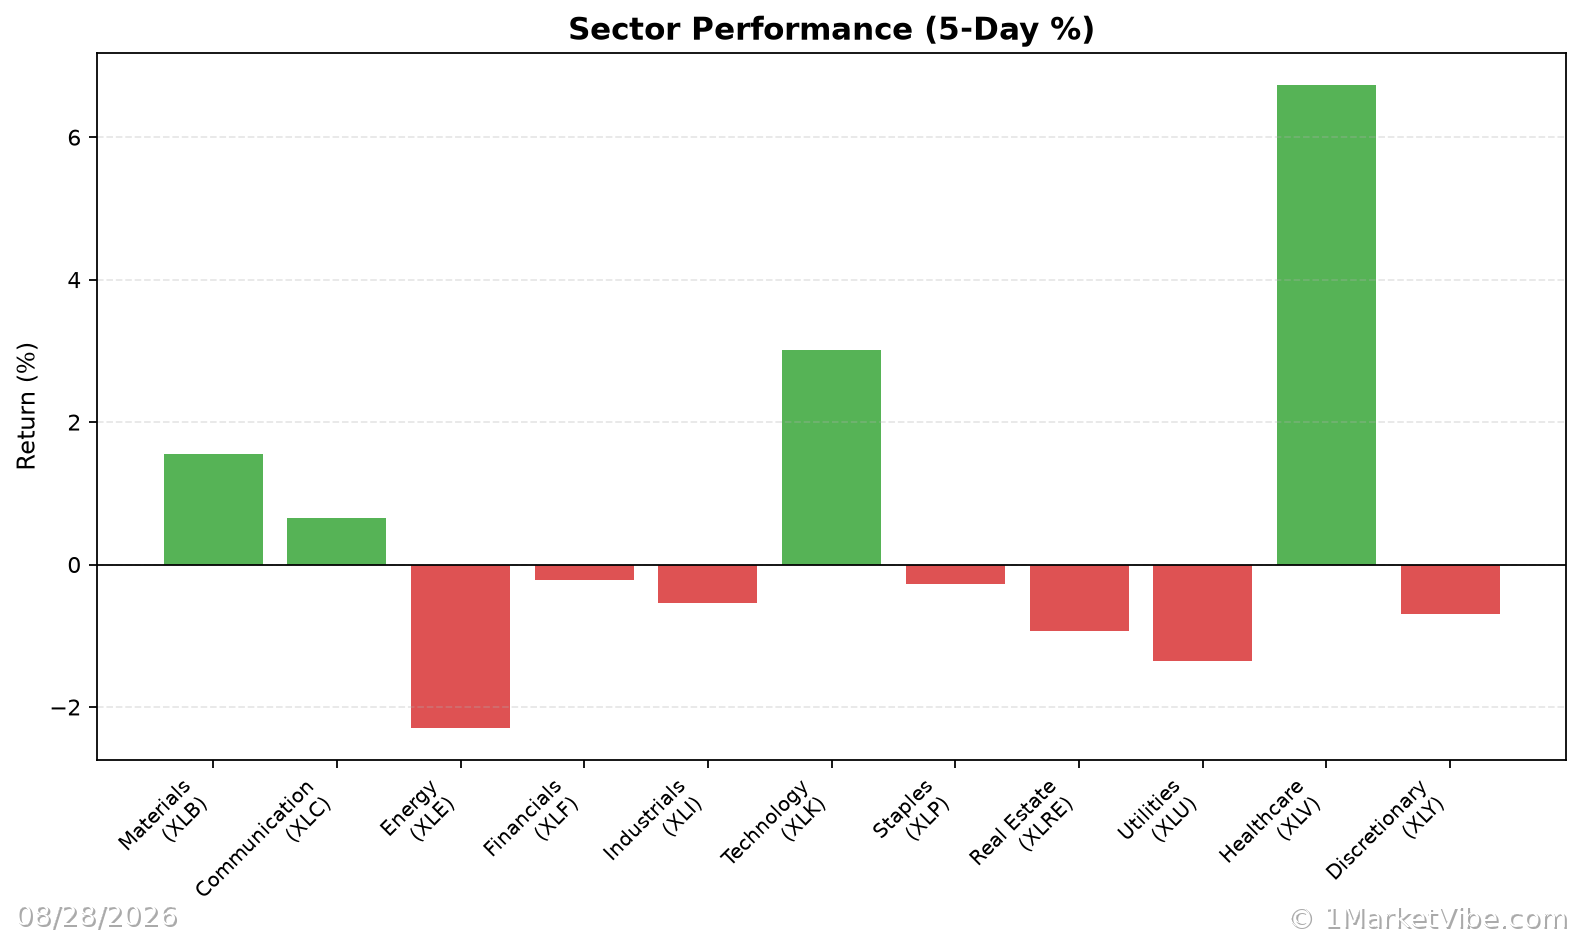
% Above 50-DMA and Sector Performance: A decline in tech sector performance due to regulatory pressures could lower the % Above 50-DMA, signaling weakening market breadth. Traders might need to reassess their exposure to tech stocks.
ATR% and Volatility: As regulatory scrutiny intensifies, ATR% could rise, reflecting increased market volatility. Traders should be prepared for potential price swings and adjust their risk management strategies.
Real-World Scenarios
Scenario 1: Regulatory Tensions and Market Volatility
Imagine a scenario where regulatory pressures on tech companies like Meta escalate. We might observe:
- CWI rising above 6, indicating elevated risk.
- % Above 50-DMA dropping below 40%, suggesting weak market breadth.
- ATR% increasing, reflecting heightened volatility.
In such a scenario, traders might feel tempted to exit positions hastily. However, a more informed approach would involve reassessing risk exposure and considering hedging strategies.
Scenario 2: Stabilization and Recovery
Conversely, if regulatory tensions ease and the tech sector stabilizes:
- CWI could decrease, signaling reduced risk.
- % Above 50-DMA might rise, indicating improving market breadth.
- ATR% could stabilize, suggesting lower volatility.
Traders could consider gradually increasing exposure, focusing on setups that align with their risk tolerance.
Incorporating Insights into a Trading Process
Practical Guidelines
- Emphasize Defense with High CWI: When CWI is high, prioritize defensive strategies and reduce new risk exposure.
- Monitor Breadth and Leadership: If % Above 50-DMA improves, consider adding exposure, provided setups align with your strategy.
- Use Market Dashboard for Context: Leverage the Market Dashboard to understand the broader market regime and confirm internal signals.
Common Misuses and Misconceptions
Misuse 1: Treating Metrics as Stand-Alone Signals
Traders often misuse metrics like CWI or % Above 50-DMA as standalone entry signals. Instead, these should guide risk posture and expectations, not precise timing.
Misuse 2: Ignoring Context
Ignoring sector rotation or broader market context can lead to misguided decisions. Always consider the full market picture.
Misuse 3: Overreacting to Short-Term Changes
Reacting to one-day metric changes can lead to whipsawing. Focus on trends and sustained shifts in metrics.
To see these breadth and risk metrics in one place each day, you can use the Decision Edge dashboard at 1marketvibe.com.
DISCLAIMER: This article is for informational purposes only and does not constitute financial advice. Always conduct your own research or consult a financial advisor before making investment decisions.