

Oil Prices Surge: Key Sectors to Monitor Amid US-Iran Tensions
- Authors

- Name
- MarketVibe Team
- @1marketvibe
Oil Prices Surge: Key Sectors to Monitor Amid US-Iran Tensions
The recent surge in oil prices, driven by escalating tensions between the US and Iran, has significant implications for traders and investors. Understanding how these geopolitical events influence market dynamics is crucial for making informed decisions. In this article, we'll explore key sectors affected by rising oil prices and how MarketVibe's metrics can help traders navigate this complex environment.
Current Tensions and Their Impact on Oil Prices
The geopolitical landscape in the Gulf region has always been a critical factor influencing oil prices. Recent developments, including increased hostilities between the US and Iran, have led to a significant spike in oil prices. This surge is not just a reaction to immediate supply concerns but also reflects broader market anxieties about future disruptions.
Why Traders Should Care
Oil price fluctuations can have a ripple effect across various sectors, influencing everything from energy stocks to consumer goods. Traders need to understand these dynamics to adjust their portfolios accordingly. MarketVibe's metrics, such as the Crash Warning Index (CWI) and sector scores, provide valuable insights into how these changes might unfold.
Understanding MarketVibe Metrics
Crash Warning Index (CWI)
The Crash Warning Index (CWI) is a composite metric that aggregates several risk dimensions, including market breadth, volatility, and defensive behavior. It serves as an early warning system for potential market corrections. A CWI reading above 6 indicates elevated risk, suggesting that traders should be cautious.
- Why It Matters: The CWI helps traders anticipate periods of heightened risk, allowing them to adjust their strategies proactively.
- Current Reading: With a CWI of 5.9, the market is on the cusp of increased volatility, signaling traders to monitor risk closely.
Sector Scores
Sector Scores provide insights into which parts of the market are leading or lagging. In the context of rising oil prices, energy sectors typically show strength, while sectors heavily reliant on oil as an input may face headwinds.
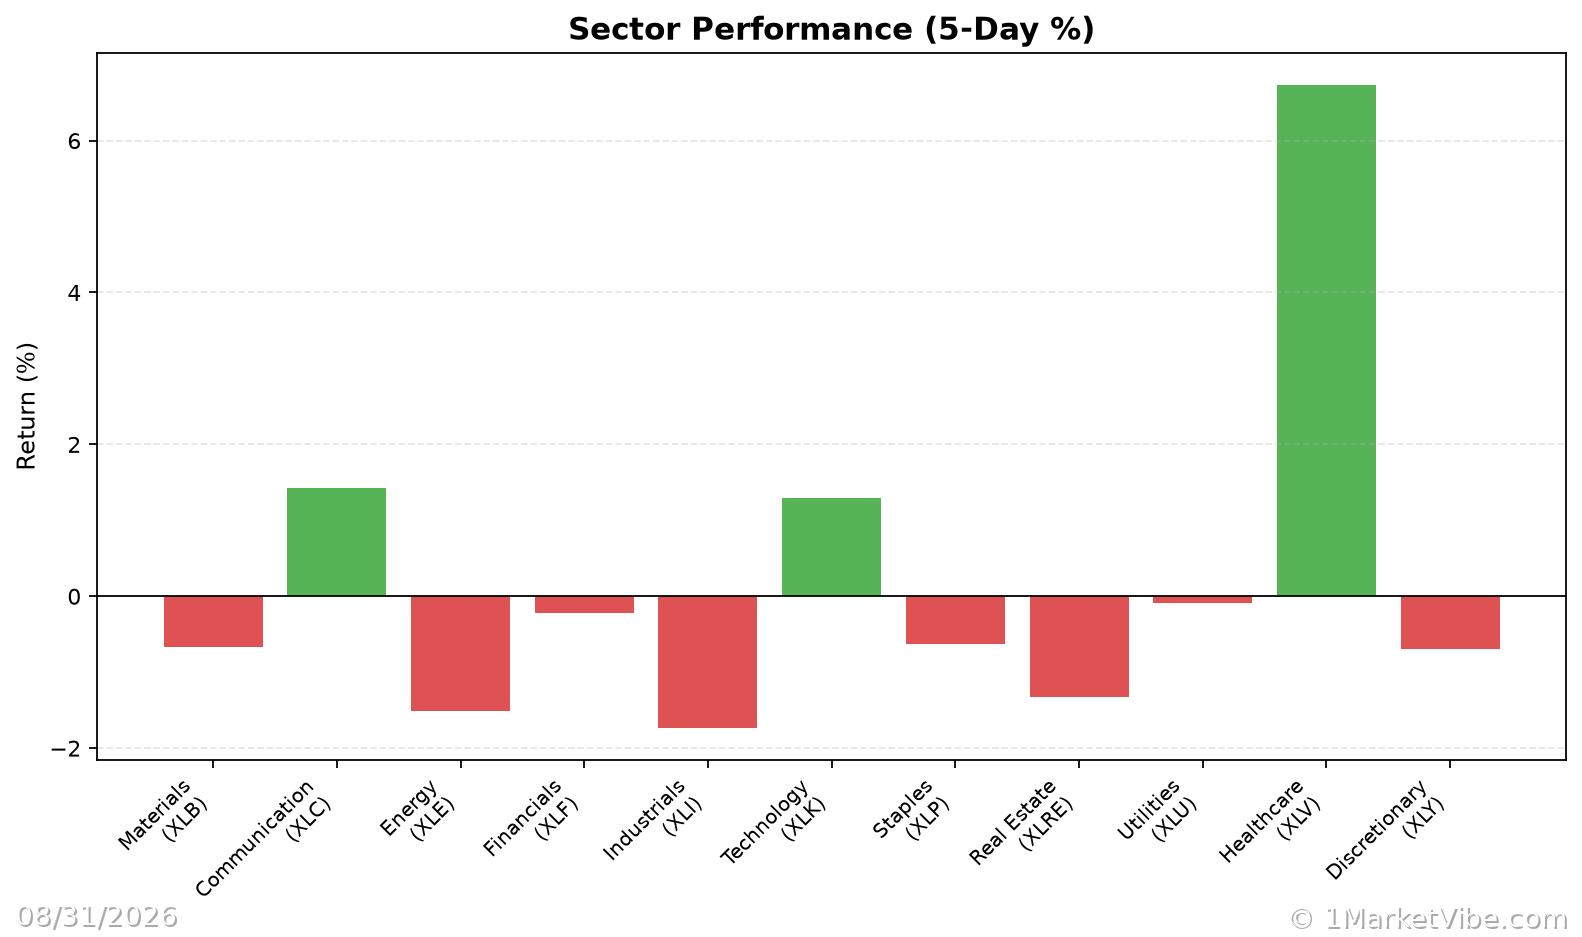
- Why It Matters: Understanding sector rotations can help traders identify opportunities and risks associated with changing market conditions.
How MarketVibe Metrics Work
CWI Mechanics
The CWI is constructed by evaluating:
- Breadth: Measures the percentage of stocks above their 50-day moving average. A decline in this metric often precedes market weakness.
- Volatility: Assessed using the Average True Range (ATR%) relative to price. Rising volatility can indicate instability.
- Defensive Behavior: Observed through the performance of defensive sectors like utilities and consumer staples.
Sector Scores Mechanics
Sector scores are derived from performance metrics across various industries, highlighting which sectors are gaining or losing momentum. This helps traders focus on areas with potential for growth or caution.
Interpretation of MarketVibe Metrics
CWI Interpretation
- CWI Below 3: Generally indicates a stable market environment with low risk.
- CWI Between 3 and 6: Suggests moderate risk, warranting closer monitoring.
- CWI Above 6: Signals elevated risk, often preceding corrections or increased volatility.
Sector Scores Interpretation
- Strong Energy Sector: Often correlates with rising oil prices, suggesting potential opportunities in energy stocks.
- Weak Consumer Discretionary: May indicate pressure from higher input costs due to increased oil prices.
Real-World Scenarios
Scenario 1: Topping Environment
Imagine a scenario where the broader market index is climbing, but the percentage of stocks above their 50-day moving average is declining. This divergence often signals a topping environment. Traders might feel tempted to chase the rally, but a more informed approach would involve reducing exposure and preparing for potential pullbacks.
Scenario 2: Bull Leg with Strong Breadth
In a strong bull market leg, the percentage of stocks above their 50-day moving average surges and remains high. This indicates robust market health, allowing traders to increase exposure confidently, provided their setups align with broader trends.
Scenario 3: Volatility Spike
A sudden increase in ATR% alongside a rising CWI suggests a volatility spike. Traders might panic and exit positions prematurely. However, understanding these metrics can help maintain composure and adjust risk exposure methodically.
How to Use This Insight in a Process
- Emphasize Defense: When breadth is weak and CWI is high, prioritize defensive strategies and reduce new risk.
- Broaden Exposure: When breadth and leadership expand, consider increasing exposure, but ensure setups are robust.
- Monitor Sector Rotations: Use sector scores to identify emerging trends and adjust portfolios accordingly.
Common Misuses & Misconceptions
- Standalone Signals: Avoid treating CWI or sector scores as standalone entry signals. They are part of a broader risk assessment framework.
- Ignoring Context: Consider sector rotations and time frames when interpreting metrics.
- Overreacting to One-Day Changes: Focus on trends rather than daily fluctuations to avoid knee-jerk reactions.
To see these breadth and risk metrics in one place each day, you can use the Decision Edge dashboard at 1marketvibe.com.
DISCLAIMER: This article is for informational purposes only and does not constitute financial advice. Trading involves risk, and you should consult with a financial advisor before making investment decisions.