


Memory Prices: Insights from Lenovo on Future Trends
In today's rapidly evolving tech landscape, understanding market dynamics is crucial for traders and investors alike. One such emerging trend is the persistent rise in memory prices, as highlighted by Lenovo's recent warnings. This article explores the implications of these trends, how they fit into broader market metrics, and what traders can do to navigate these changes effectively.
Orientation – What Are We Explaining?
The focus here is on understanding the persistent high memory prices and their implications for the tech market. Traders should care about this trend because it affects the cost structure of tech companies, influences consumer pricing, and can signal shifts in market leadership and sector performance. By integrating this understanding with MarketVibe's metrics, traders can better assess risk and opportunity in the tech sector.
How It Works – Mechanics & Data
Memory Price Trends
Memory prices, particularly for DRAM and NAND, have been on an upward trajectory due to supply constraints and high demand from data centers. Lenovo's insights suggest that these prices may not revert to previous levels, indicating a potential "new normal" in the market. This trend is driven by:
- Supply Chain Constraints: Ongoing disruptions have limited production capacity.
- Increased Demand: Data centers and cloud services are major consumers, driving up prices.
- Technological Advancements: Newer technologies require more memory, further increasing demand.
MarketVibe Metrics
To contextualize these price trends, we can look at several MarketVibe metrics:
- % Above 50-DMA: This breadth indicator shows how many stocks are trading above their 50-day moving average, reflecting overall market health.
- Crash Warning Index (CWI): A composite measure that includes breadth, volatility, and defensive behavior to assess market risk.
- ATR% (Average True Range Percentage): A volatility measure that indicates market stability or instability.
These metrics help traders understand the broader market environment in which memory price trends are occurring.
Interpretation – What Different Levels Tend to Mean
Market Regimes
- High % Above 50-DMA: Indicates a strong market with broad participation, suggesting that rising memory prices may not immediately derail tech sector performance.
- Elevated CWI: If the CWI is above 6, it signals heightened market risk, which could be exacerbated by rising input costs like memory.
- High ATR%: Suggests increased volatility, which might accompany periods of rapid price adjustments in tech stocks due to cost pressures.
Common Combinations
- Strong Breadth + Low Volatility: Ideal for risk-taking, even if memory prices are high, as the market can absorb cost pressures.
- Weak Breadth + Rising Volatility: Caution is advised, as this combination suggests market stress, potentially aggravated by high memory costs.
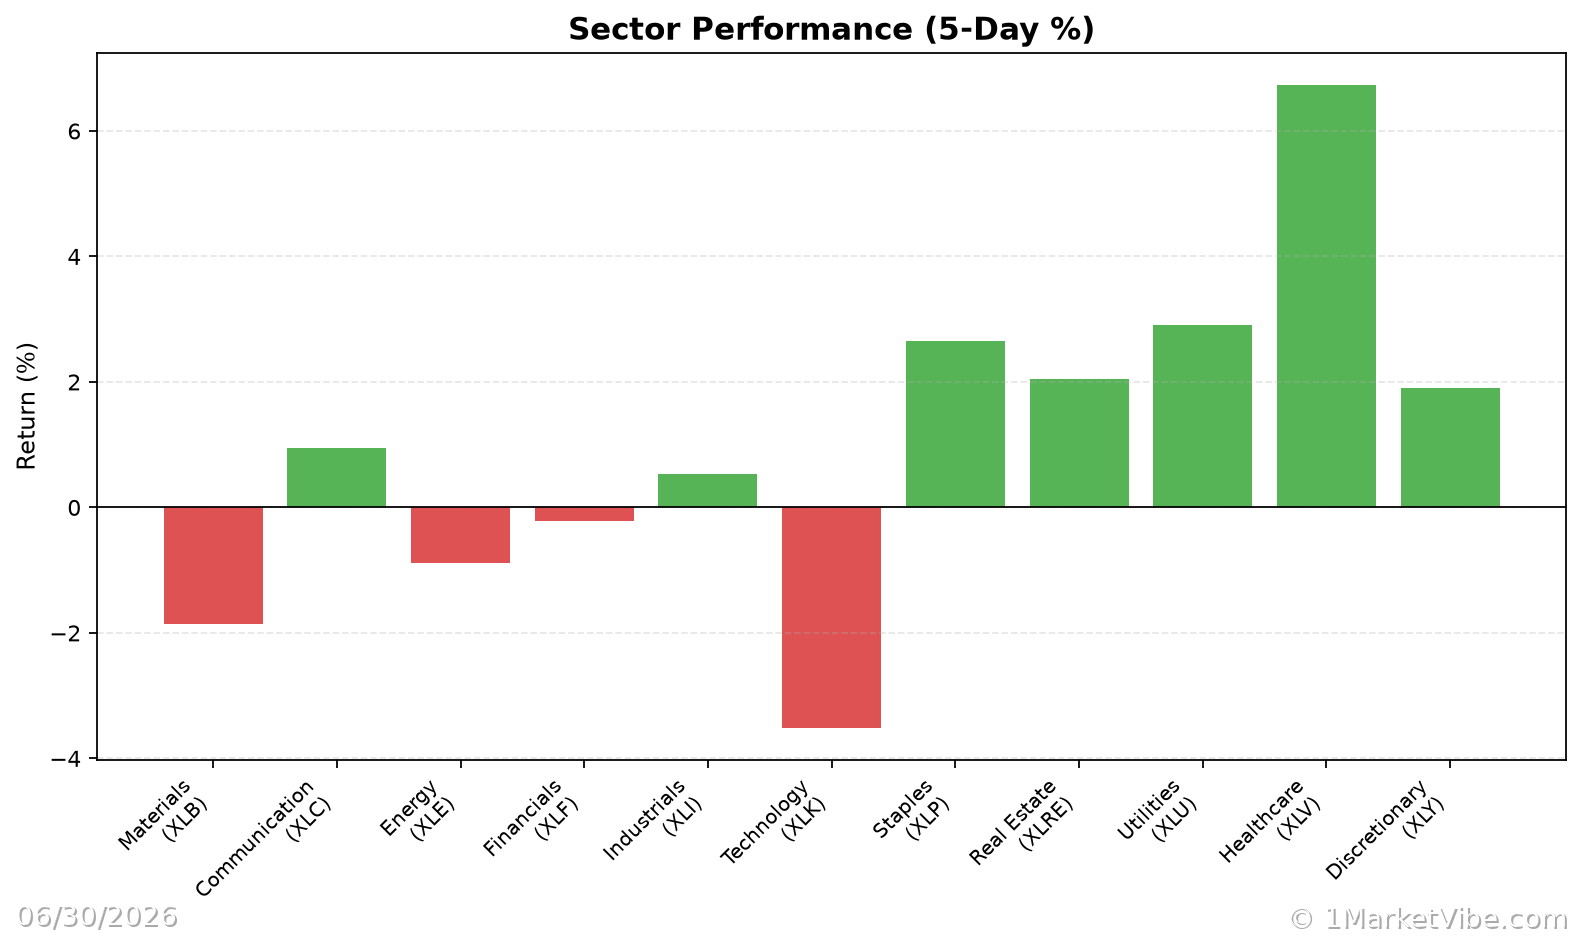
- Defensive Sectors Leading: Indicates a shift towards safety, possibly in response to sustained high input costs.
Real-World Scenarios – How This Shows Up in Markets
Scenario 1: Topping Environment
Imagine a scenario where major indices are reaching new highs, but the % Above 50-DMA is declining. This divergence suggests that fewer stocks are participating in the rally, often a precursor to a market top. In this environment, high memory prices could further strain tech companies' margins, accelerating a downturn.
Scenario 2: Bull Market Leg
Conversely, if % Above 50-DMA surges and remains high, it indicates robust market health. Even with high memory prices, strong demand and broad participation can support a continued bull run, especially if tech companies successfully pass costs onto consumers.
Scenario 3: Volatility Spike
A sudden increase in ATR% could indicate a volatility spike, often seen during earnings seasons or macroeconomic announcements. If this coincides with rising memory prices, traders might see sharp moves in tech stocks, necessitating a cautious approach.
How to Use This Insight in a Process
Practical Guidelines
- Emphasize Defense: When breadth is weak and CWI is high, reduce new risk and focus on defensive sectors.
- Broaden Exposure: If breadth and leadership are strong, consider adding exposure, but ensure setups align with your strategy.
- Monitor Market Dashboard: Use it as a high-level regime label, then check internals for confirmation.
These guidelines help traders align their risk posture with market conditions, rather than relying on memory price trends alone.
Common Misuses & Misconceptions
Misuse 1: Stand-Alone Signal
Traders often mistake metrics like % Above 50-DMA as entry signals. Instead, use them to gauge market health and inform broader strategy decisions.
Misuse 2: Ignoring Context
Ignoring sector rotation or time frame can lead to misinterpretations. Always consider the broader market context and how memory prices fit into it.
Misuse 3: Overreacting to One-Day Changes
Day-to-day fluctuations can be misleading. Focus on trends and sustained changes in metrics to guide decisions.
To see these breadth and risk metrics in one place each day, you can use the Decision Edge dashboard at 1marketvibe.com.
Disclaimer: This article is for informational purposes only and should not be considered financial advice. Always conduct your own research before making investment decisions.