
McDonald's Q1 2026 Earnings Insights for Investors
As McDonald's releases its Q1 2026 earnings report, investors are keen to understand the implications for their portfolios. The fast-food giant's performance offers insights not only into its own operations but also into broader economic trends affecting consumer behavior. In this article, we'll explore the key takeaways from McDonald's earnings, analyze the factors influencing its stock, and provide guidance on how investors can use MarketVibe's metrics to inform their decision-making process.
Recent Performance
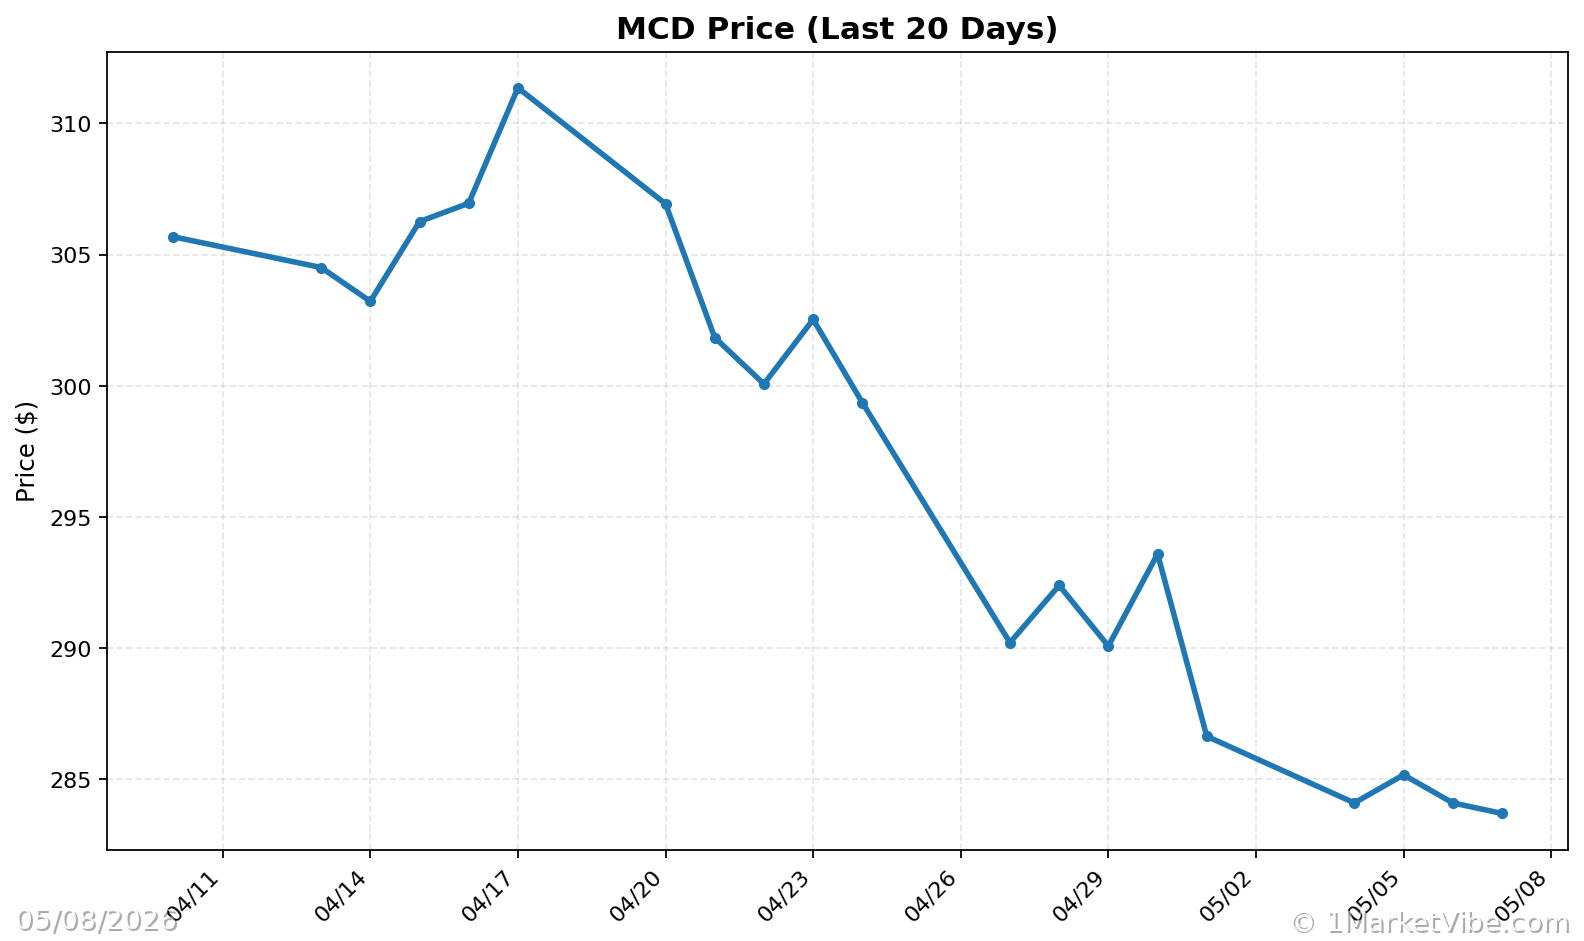
McDonald's shares have declined by 10% over the past year, reflecting concerns about the broader economy and consumer spending patterns. Several factors have contributed to this decline, including rising gas prices and inflation, which disproportionately affect low-income consumers—a significant demographic for McDonald's. Despite these challenges, the company has managed to report earnings and revenue that exceed analysts' expectations, thanks to strategic pricing and marketing initiatives.
Economic Context
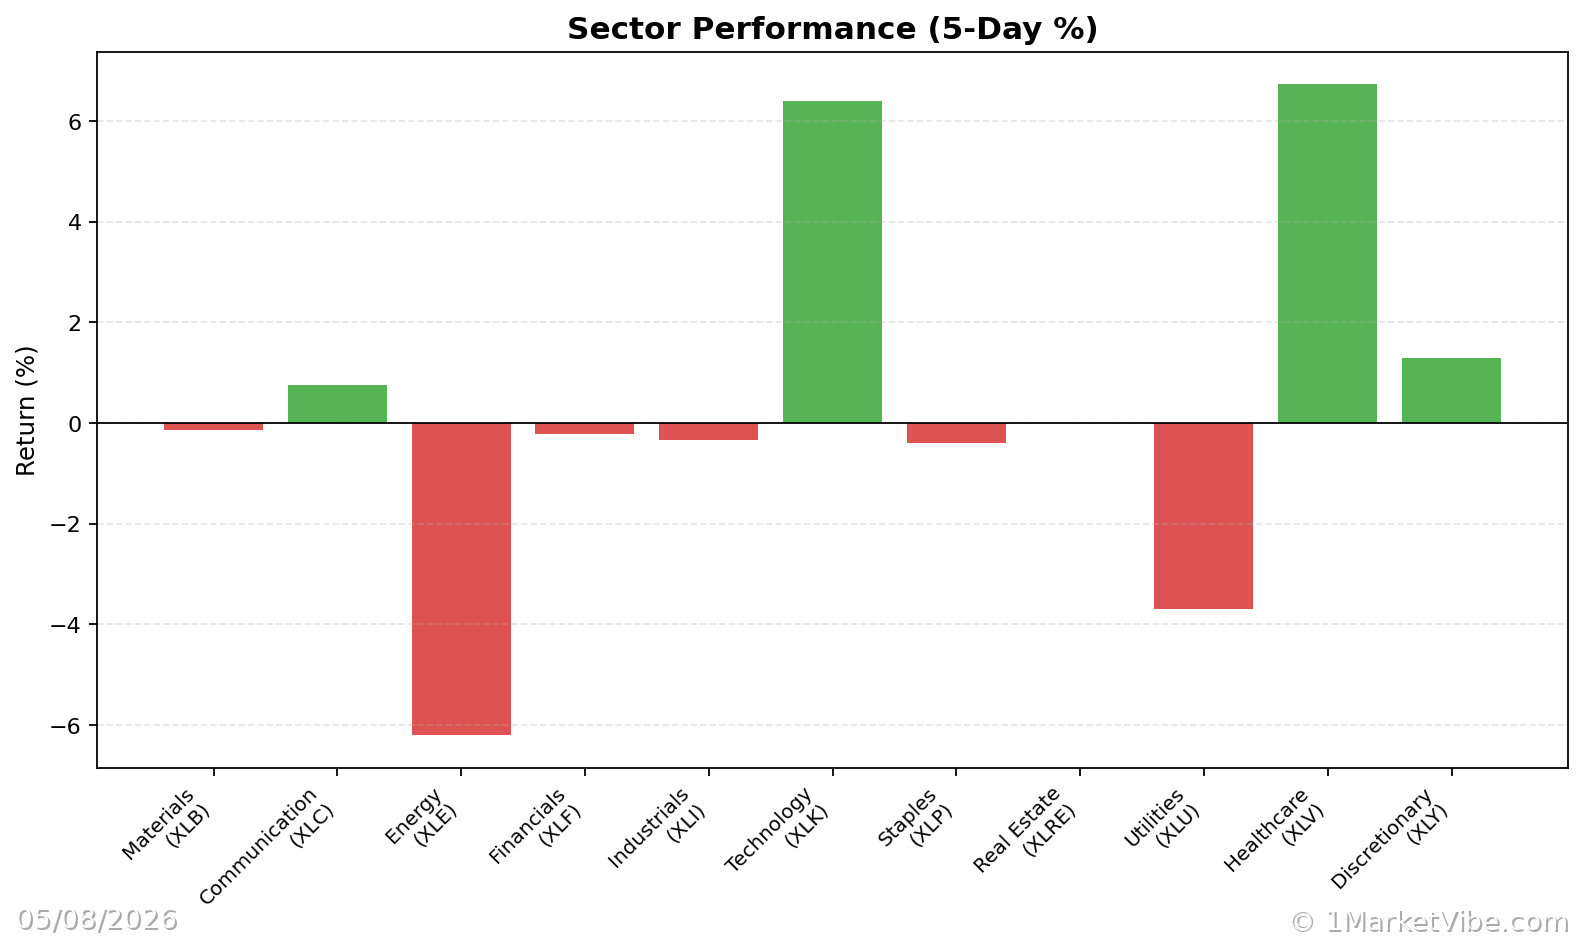
The current economic environment poses significant challenges for consumer-facing companies like McDonald's. Elevated gas prices, partly due to geopolitical tensions, have reduced disposable income for many consumers. This trend is consistent across the restaurant industry, with competitors like Domino's Pizza and Chipotle Mexican Grill also reporting softened sales. However, McDonald's has leveraged its value offerings to capture market share, even as overall dining-out frequency declines.
Earnings Expectations
For Q1 2026, McDonald's reported a net income of $1.98 billion, or $2.78 per share, up from $1.87 billion, or $2.60 per share, a year earlier. Excluding restructuring charges, the earnings per share were $2.83, slightly above Wall Street's consensus. Same-store sales increased by 3.8%, driven by higher customer spending per visit. These figures suggest that while economic pressures persist, McDonald's strategic initiatives are resonating with consumers.
Potential Risks
Despite the positive earnings report, risks remain. The ongoing economic pressures, particularly those affecting low-income consumers, could impact McDonald's future performance. Additionally, the company's decision to potentially sell its company-owned restaurants to franchisees indicates challenges in maintaining margins at these locations. Investors should monitor these developments closely, as they could influence McDonald's long-term growth trajectory.
Market Reactions
Historically, McDonald's earnings reports have elicited varied market reactions. In this instance, shares initially rose more than 3% in premarket trading but lost some gains as executives expressed concerns about the consumer environment. This pattern underscores the importance of understanding market sentiment and the broader economic context when interpreting earnings results.
Using MarketVibe Metrics for Insight
Breadth and Volatility
MarketVibe's % Above 50-DMA metric can help investors gauge the health of McDonald's stock trend. A high percentage indicates strong breadth and a healthy trend, while a low percentage suggests potential weakness. In the current environment, where McDonald's faces economic headwinds, monitoring this metric can provide early warnings of trend reversals.
Crash Warning Index (CWI)
The Crash Warning Index (CWI) is a composite measure that assesses market risk by evaluating factors like breadth, volatility, and defensive behavior. A CWI above 6 indicates elevated risk, suggesting that investors should adopt a more defensive posture. Given the uncertainties surrounding consumer spending, keeping an eye on the CWI can help investors adjust their risk exposure appropriately.
ATR% and Volatility Regimes
The ATR% measures volatility relative to price, offering insights into market stability. Low ATR% values typically correspond to quiet, trending phases, while high ATR% values indicate choppy or unstable conditions. For McDonald's, a rising ATR% could signal increased volatility due to economic pressures, prompting investors to reassess their positions.
Real-World Scenarios
Scenario 1: Economic Pressures Intensify
If economic pressures continue to mount, we might see a scenario where McDonald's stock trend weakens, reflected in a declining % Above 50-DMA. Investors might feel tempted to sell in response to short-term volatility. However, a more informed approach would involve monitoring the CWI and ATR% to assess whether these pressures are likely to lead to a broader market correction.
Scenario 2: Strategic Initiatives Pay Off
Conversely, if McDonald's strategic initiatives successfully drive consumer engagement, the % Above 50-DMA could remain elevated, indicating a strong trend. In this case, investors might consider adding exposure, provided their setups align with broader market conditions.
Scenario 3: Volatility Spike
A sudden spike in volatility, captured by a rising ATR%, could occur if geopolitical tensions escalate. In such a scenario, the CWI might also rise, signaling increased market risk. Investors should consider hedging strategies or reducing exposure to mitigate potential losses.
How to Use This Insight in a Process
To effectively incorporate these insights into your investment process, consider the following guidelines:
- Emphasize Defense: When breadth is weak and CWI is high, prioritize defensive strategies and limit new risk.
- Broaden Exposure: When breadth and leadership improve, be open to increasing exposure, but ensure your setups are robust.
- Monitor the Market Dashboard: Use MarketVibe's Decision Edge dashboard to get a high-level view of market regimes and confirm internal signals.
Common Misuses & Misconceptions
- Stand-Alone Signal: Avoid treating any single metric as a stand-alone entry or exit signal. Always consider the broader context.
- Ignoring Sector Rotation: Pay attention to sector dynamics, as they can influence individual stock performance.
- Overreacting to Daily Changes: Focus on trends and patterns rather than reacting to short-term fluctuations.
To see these breadth and risk metrics in one place each day, you can use the Decision Edge dashboard at 1marketvibe.com.
This analysis is provided for informational purposes only and does not constitute investment advice, a recommendation, or an offer or solicitation to buy or sell any securities. MarketVibe content reflects observable market data and historical context as of the publication date and should not be relied upon as a sole source for making investment decisions.
Charts