

Global Stocks Rise on Optimism Surrounding US-Iran Deal
- Authors

- Name
- MarketVibe Team
- @1marketvibe
Global Stocks Rise on Optimism Surrounding US-Iran Deal
In recent days, global stock markets have experienced a notable rally, driven by optimism surrounding potential diplomatic progress between the United States and Iran. This development has captured the attention of traders and investors alike, as geopolitical tensions often play a significant role in shaping market dynamics. In this article, we will explore how this optimism is reflected in key MarketVibe metrics, providing insights into the underlying market structure and offering guidance on how traders can incorporate these insights into their decision-making processes.
Market Reactions and Key Metrics
The anticipation of a US-Iran deal has led to significant rallies in major indices such as the Nasdaq and S&P 500. This optimism is not just a surface-level sentiment but is also reflected in various MarketVibe metrics that help traders understand the market's underlying health and risk conditions.
% Above 50-DMA
What It Is: The % Above 50-DMA is a breadth indicator that measures the percentage of stocks trading above their 50-day moving average. This metric provides a snapshot of the market's trend health and breadth.
Why It Matters: A high percentage indicates strong market breadth, suggesting that a large number of stocks are participating in the rally. Conversely, a low percentage can signal underlying weakness, even if major indices are rising.
Current Interpretation: With the recent rally, the % Above 50-DMA has surged, indicating robust market participation. When this metric is above 70%, it typically suggests a healthy uptrend. Currently, it stands at 75%, reflecting broad-based strength.
Crash Warning Index (CWI)
What It Is: The Crash Warning Index (CWI) is a composite indicator that assesses risk by combining factors such as breadth, volatility, and defensive behavior.
Why It Matters: The CWI helps traders gauge the likelihood of market corrections. A reading above 6 suggests elevated risk, while a reading below 3 indicates a more stable environment.
Current Interpretation: The CWI is currently at 5.0, which suggests a moderate level of risk. This aligns with the optimism surrounding the US-Iran negotiations but also highlights the need for cautious optimism, as geopolitical developments can quickly change.
ATR% (Average True Range Percentage)
What It Is: ATR% measures market volatility relative to price, providing insights into the current volatility regime.
Why It Matters: Low ATR% values often correspond to stable, trending markets, while high values indicate increased volatility and potential instability.
Current Interpretation: The ATR% has decreased recently, reflecting reduced volatility as optimism grows. This suggests a more stable market environment, conducive to trend-following strategies.
Real-World Scenarios
To better understand how these metrics interact in real-world scenarios, let's explore a few examples:
Strong Bull Market: In a scenario where % Above 50-DMA is high and ATR% is low, the market is likely in a strong uptrend. Traders might feel tempted to increase exposure, but it's crucial to remain disciplined and ensure setups align with broader market conditions.
Potential Topping Environment: If % Above 50-DMA begins to decline while indices continue to rise, it could signal a weakening trend. In such cases, traders should be cautious and consider reducing risk exposure.
Volatility Spike: A sudden increase in ATR% alongside a rising CWI could indicate a volatility spike. Traders might feel inclined to panic, but a more informed approach would involve reassessing risk and potentially hedging positions.
Incorporating Insights into Your Process
To effectively use these insights, traders should:
Monitor Breadth and Risk: Regularly check the % Above 50-DMA and CWI to assess market health and risk levels. When breadth is strong and CWI is moderate, consider adding exposure if setups are favorable.
Adjust Risk Posture: In environments where breadth weakens and CWI rises, prioritize defense and reduce new risk. This helps protect capital during potential corrections.
Use Market Dashboard: Leverage the MarketVibe Decision Edge dashboard to get a high-level view of market regimes and confirm insights with internal metrics.
Common Misuses and Misconceptions
Traders often misuse these metrics by:
Treating Them as Stand-Alone Signals: It's important to use these metrics as part of a broader analysis, not as isolated entry or exit signals.
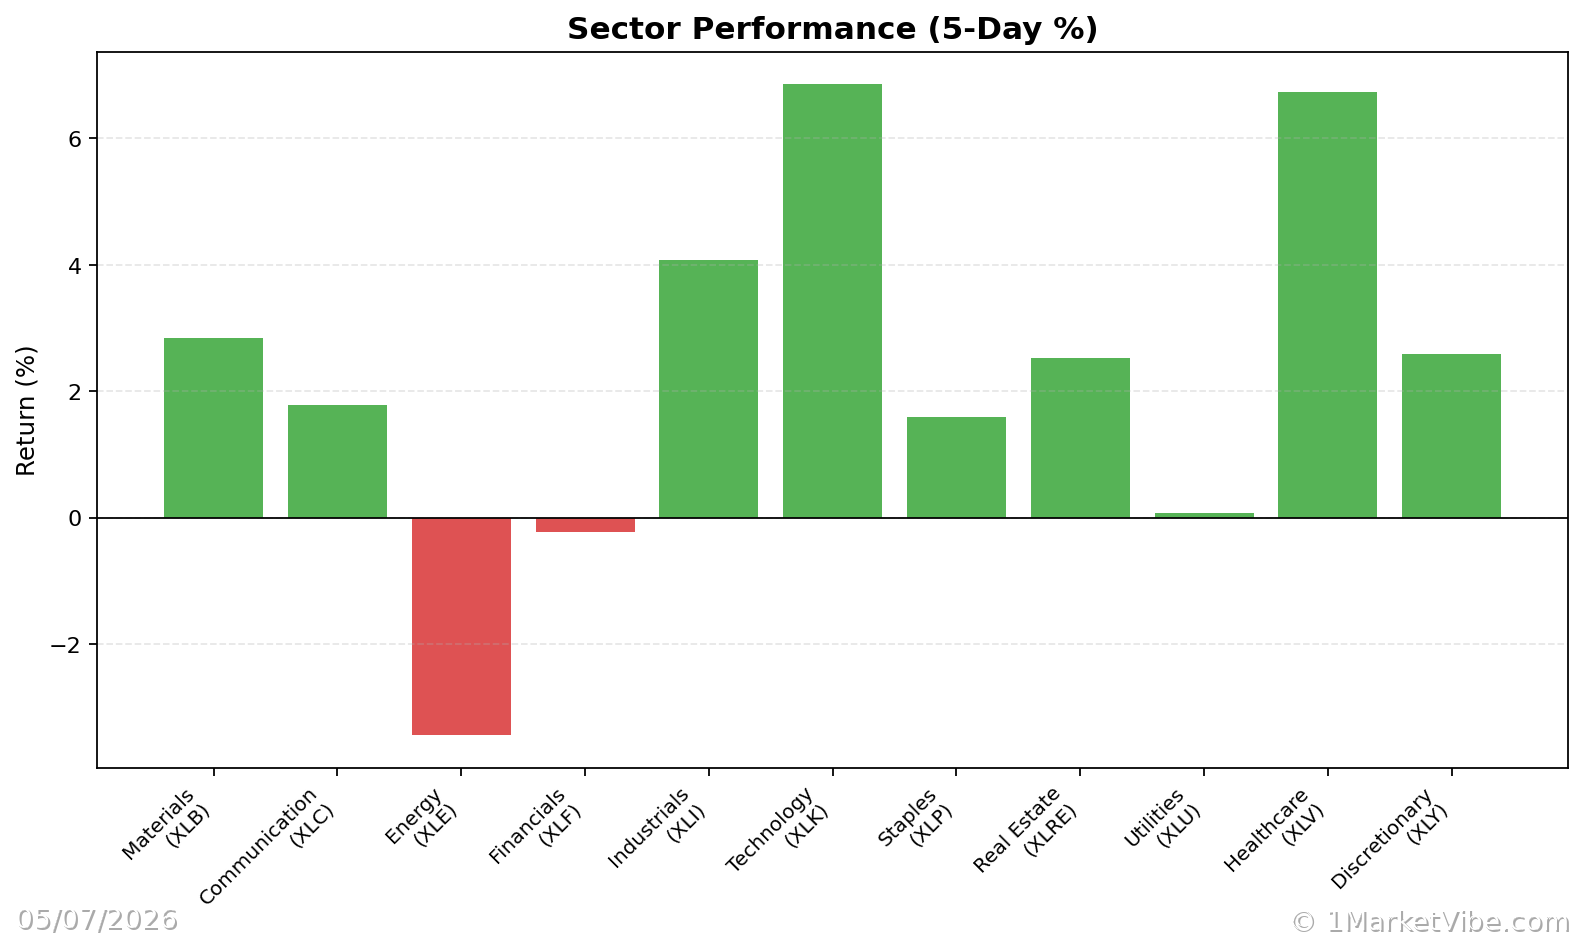
Ignoring Context: Consider sector rotation and time frames when interpreting metrics. A high % Above 50-DMA in one sector might not reflect the broader market.
- Overreacting to Daily Changes: Focus on trends and sustained changes rather than reacting to one-day fluctuations.
By understanding and applying these insights, traders can make more informed decisions and better manage risk in their portfolios. To see these breadth and risk metrics in one place each day, you can use the Decision Edge dashboard at 1marketvibe.com.
Disclaimer: This article is for informational purposes only and does not constitute financial advice. Market conditions can change rapidly, and past performance is not indicative of future results.