

Iran Tensions Fuel LNG Price Surge and Investor Strategies
- Authors

- Name
- MarketVibe Team
- @1marketvibe
Iran Tensions Fuel LNG Price Surge and Investor Strategies
Introduction
The geopolitical landscape is a significant driver of market dynamics, and recent tensions involving Iran have underscored this reality. These tensions have notably impacted Liquefied Natural Gas (LNG) prices, creating ripples across global energy markets. Understanding these shifts is crucial for traders and investors who need to navigate the complexities of market volatility and risk management. This article will explore how these geopolitical events influence LNG prices and how MarketVibe's metrics, such as the Crash Warning Index (CWI), can guide investor strategies.
Current Market Conditions
The Crash Warning Index (CWI) is currently reading at 5.1, indicating a moderate level of market risk. This index is a composite measure that incorporates various risk dimensions, including market breadth, volatility, and defensive sector behavior. A CWI reading in this range suggests that while the market is not in immediate danger of a crash, there are elevated risks that warrant caution.
In the context of rising LNG prices, this CWI level reflects the market's sensitivity to geopolitical developments. As tensions with Iran escalate, the potential for disruptions in energy supply chains increases, leading to price volatility in the LNG market. Traders should be aware that such geopolitical risks can lead to sudden shifts in market sentiment and pricing.
Geopolitical Impact
The conflict involving Iran has significant implications for global energy supply chains. Iran is strategically located near major oil and gas shipping routes, and any disruption in this region can have a cascading effect on global energy markets. The Strait of Hormuz, a critical chokepoint for oil and LNG shipments, is particularly vulnerable to geopolitical tensions.
These disruptions can lead to increased volatility in energy prices, as markets react to potential supply shortages. For investors, understanding these dynamics is crucial for managing risk and making informed decisions about energy sector investments.
Economic Indicators
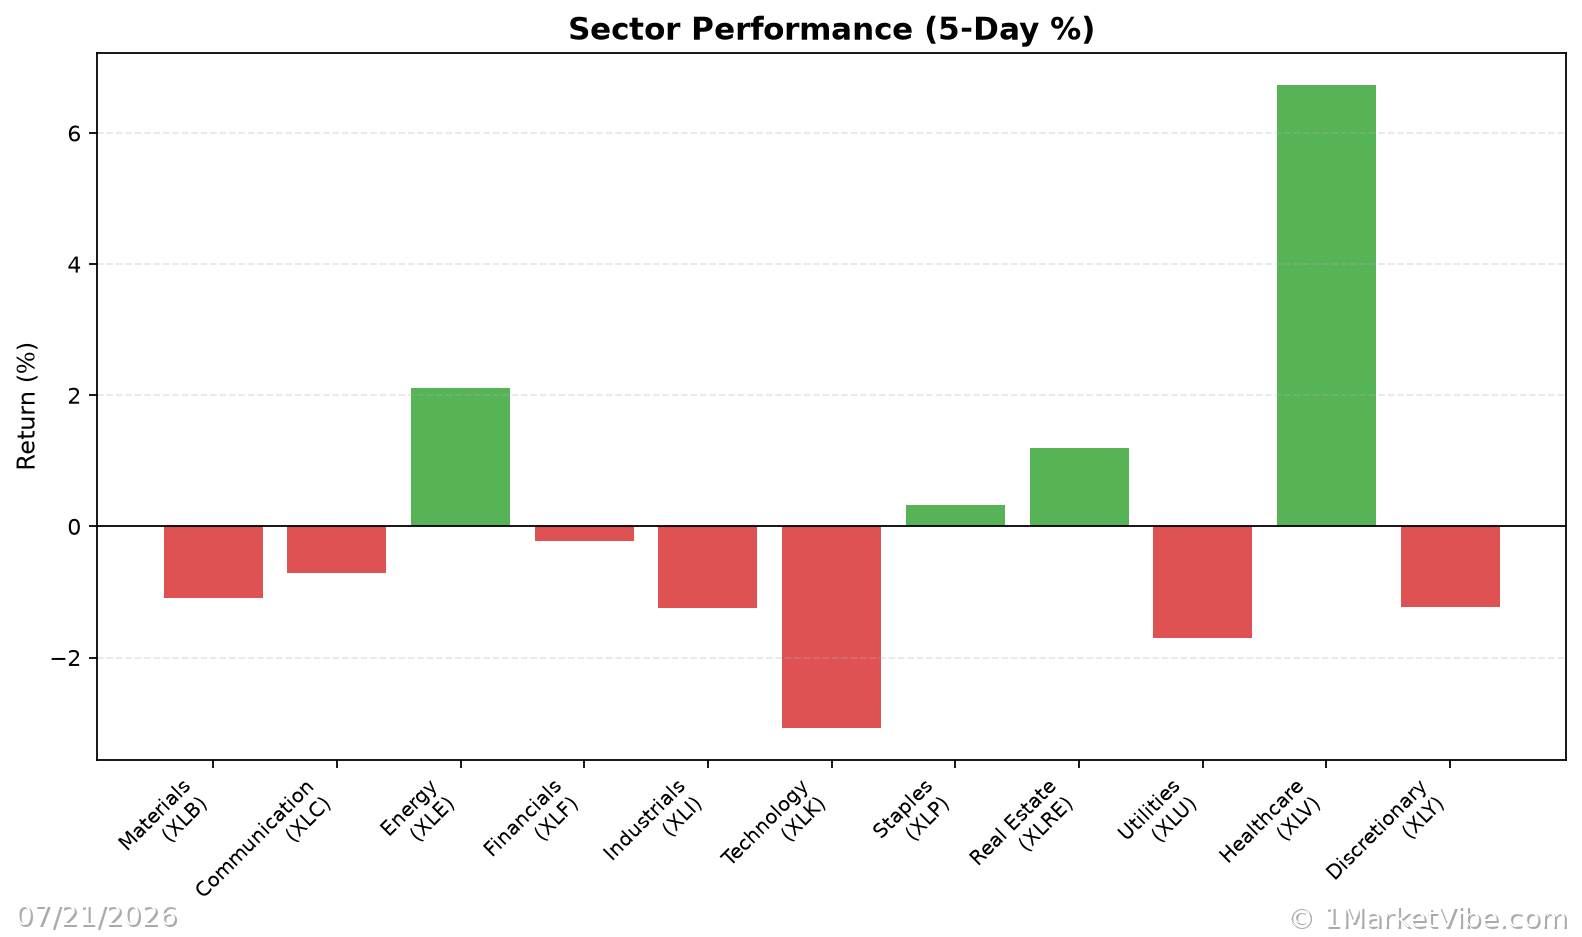
The impact of geopolitical tensions extends beyond energy markets. Broader economic indicators, such as stock market performance and investor sentiment, are also affected. For instance, recent reports indicate mixed performance in Asian stock markets as investors reassess their positions in light of geopolitical risks.
MarketVibe's % Above 50-DMA metric, which measures the percentage of stocks trading above their 50-day moving average, can provide insights into market breadth and trend health. A declining percentage in this metric may indicate weakening market breadth, suggesting that fewer stocks are participating in upward trends, which can be a warning sign for investors.
Market Volatility
Volatility is a key consideration in the current market environment. The ATR% (Average True Range Percentage) is a useful metric for gauging market volatility. It measures price volatility relative to the price level, providing insights into market stability. High ATR% values often correspond to choppy or unstable market phases, which are common during periods of geopolitical tension.
Investors should monitor ATR% closely, as rising volatility can signal increased risk and the potential for rapid price movements. In such environments, maintaining a defensive investment posture and considering hedging strategies can be prudent.
Future Considerations
The predictive capability of the CWI is particularly valuable in anticipating market shifts. With a current reading of 5.1, the index suggests that while immediate crash risks are moderate, the potential for increased volatility and market corrections remains. Investors should be prepared for potential economic fallout if geopolitical tensions escalate further.
Real-World Scenarios
Let's consider a few scenarios to illustrate how these metrics interact in real-world markets:
Topping Environment: Suppose the market index continues to rise, but the % Above 50-DMA declines. This divergence indicates that fewer stocks are driving the index higher, suggesting a potential topping pattern. In this scenario, traders might feel tempted to chase the rally, but a more informed approach would be to exercise caution and reduce exposure.
Bull Leg Surge: Imagine a scenario where geopolitical tensions ease, leading to a surge in % Above 50-DMA. This broadening of market participation could signal the start of a new bull leg. Traders should look for confirmation in other metrics, such as a declining CWI, before increasing exposure.
Volatility Spike: In a situation where ATR% spikes due to geopolitical events, traders might react by exiting positions to avoid losses. However, a more strategic approach would involve assessing the CWI and broader market conditions to determine if the volatility is a temporary reaction or indicative of deeper market instability.
How to Use This Insight in a Process
To effectively incorporate these insights into a trading process, consider the following guidelines:
- Emphasize Defense: When market breadth is weak and the CWI is high, prioritize defensive strategies and reduce new risk exposure.
- Broaden Exposure: If market breadth and leadership improve, consider adding exposure, provided your setups align with broader market conditions.
- Use Market Dashboard: Leverage the MarketVibe Decision Edge dashboard to get a high-level view of market regimes and confirm internal metrics before making decisions.
Common Misuses & Misconceptions
Traders often misuse these metrics by:
- Treating as Stand-Alone Signals: Avoid using any single metric as a definitive entry or exit signal. Always consider the broader market context.
- Ignoring Sector Rotation: Pay attention to sector leadership and rotation, as these can provide additional insights into market dynamics.
- Overreacting to Daily Changes: Focus on trends and patterns rather than reacting to one-day fluctuations, which can lead to premature decisions.
To see these breadth and risk metrics in one place each day, you can use the Decision Edge dashboard at 1marketvibe.com.
Disclaimer: This article is for informational purposes only and should not be considered financial advice. Always consult with a financial advisor before making investment decisions.