

Implications of Oil Surpassing $90 for Market Volatility
- Authors

- Name
- MarketVibe Team
- @1marketvibe
Implications of Oil Surpassing $90 for Market Volatility
1. Orientation – What Are We Explaining?
In this article, we explore the implications of oil prices surpassing $90 per barrel on market volatility. Understanding this relationship is crucial for traders because oil prices can significantly influence market stability and investor sentiment. By examining how oil price movements interact with market volatility, traders can make more informed decisions regarding risk management and portfolio adjustments.
Traders should care about this topic because oil is a critical input in the global economy, affecting everything from transportation costs to manufacturing expenses. A surge in oil prices can lead to increased inflationary pressures, which may prompt central banks to adjust monetary policies, thereby impacting financial markets. By integrating this understanding into their trading process, traders can reduce blind spots related to macroeconomic shifts and better anticipate market reactions.
2. How It Works – Mechanics & Data
Market Volatility and Oil Prices:
Market volatility is often measured using metrics like the Average True Range (ATR%) and the Crash Warning Index (CWI). The ATR% measures volatility relative to price, providing insights into the market's stability. A rising ATR% indicates increasing volatility, often associated with market uncertainty or instability.
The CWI is a composite index that aggregates several risk dimensions, including breadth, volatility, and defensive behavior. It serves as an early warning system for potential market corrections. When oil prices rise sharply, these metrics can be affected in the following ways:
- ATR%: A spike in oil prices can lead to increased market volatility as investors react to potential economic impacts, driving up the ATR%.
- CWI: A higher CWI reading may occur if rising oil prices lead to broader market concerns, such as inflation or geopolitical tensions.
3. Interpretation – What Different Levels Tend to Mean
ATR% Ranges:
- Low ATR%: Typically indicates a stable, trending market. Traders might see this during periods of low oil price volatility.
- High ATR%: Suggests a choppy or unstable market, often seen when oil prices surge unexpectedly.
CWI Levels:
- Below 3: Indicates low risk of market corrections. Oil price movements are likely not causing significant concern.
- Between 3 and 6: Suggests a neutral to moderate risk environment. Oil price increases might be contributing to cautious sentiment.
- Above 6: Signifies elevated risk, with potential for market corrections. This could happen if oil prices continue to rise sharply, exacerbating economic concerns.
4. Real-World Scenarios – How This Shows Up in Markets
Scenario 1: Topping Environment
Imagine a scenario where oil prices rise above $90, and the broader market index continues to grind higher. However, the % Above 50-DMA metric shows deteriorating breadth, indicating fewer stocks are participating in the rally. Traders might feel tempted to chase the rally, but a more informed view would recognize the underlying weakness and potential for a pullback.
Scenario 2: Bull Leg with Strong Breadth
In another scenario, oil prices stabilize after a surge, and the % Above 50-DMA metric shows a broadening of market participation. This suggests a strong new bull leg, where traders can be more open to adding exposure, provided their setups align with the broader trend.
Scenario 3: Volatility Spike
Consider a situation where oil prices surge due to geopolitical tensions, causing a spike in ATR% and an acceleration in the CWI. Traders might panic and make hasty decisions, but a more informed approach would involve reassessing risk exposure and considering hedging strategies to manage volatility.
5. How to Use This Insight in a Process
- Risk Management: When oil prices rise and market volatility increases, emphasize defensive strategies and reduce new risk exposure. Use the Market Dashboard to assess the overall risk climate.
- Exposure Adjustment: If oil prices stabilize and market breadth improves, consider adding exposure, but ensure your setups are in alignment with the broader market trend.
- Monitoring: Regularly check the Decision Edge Dashboard for updates on breadth, CWI, and volatility metrics to maintain an informed risk posture.
6. Common Misuses & Misconceptions
- Stand-Alone Signal: Avoid treating oil price movements as a stand-alone entry signal. Consider the broader market context and other indicators.
- Ignoring Context: Don't overlook sector rotations or time frames. Oil price impacts can vary across sectors and time horizons.
- Overreacting to Daily Changes: Resist the urge to overreact to one-day oil price changes. Focus on sustained trends and broader market signals.
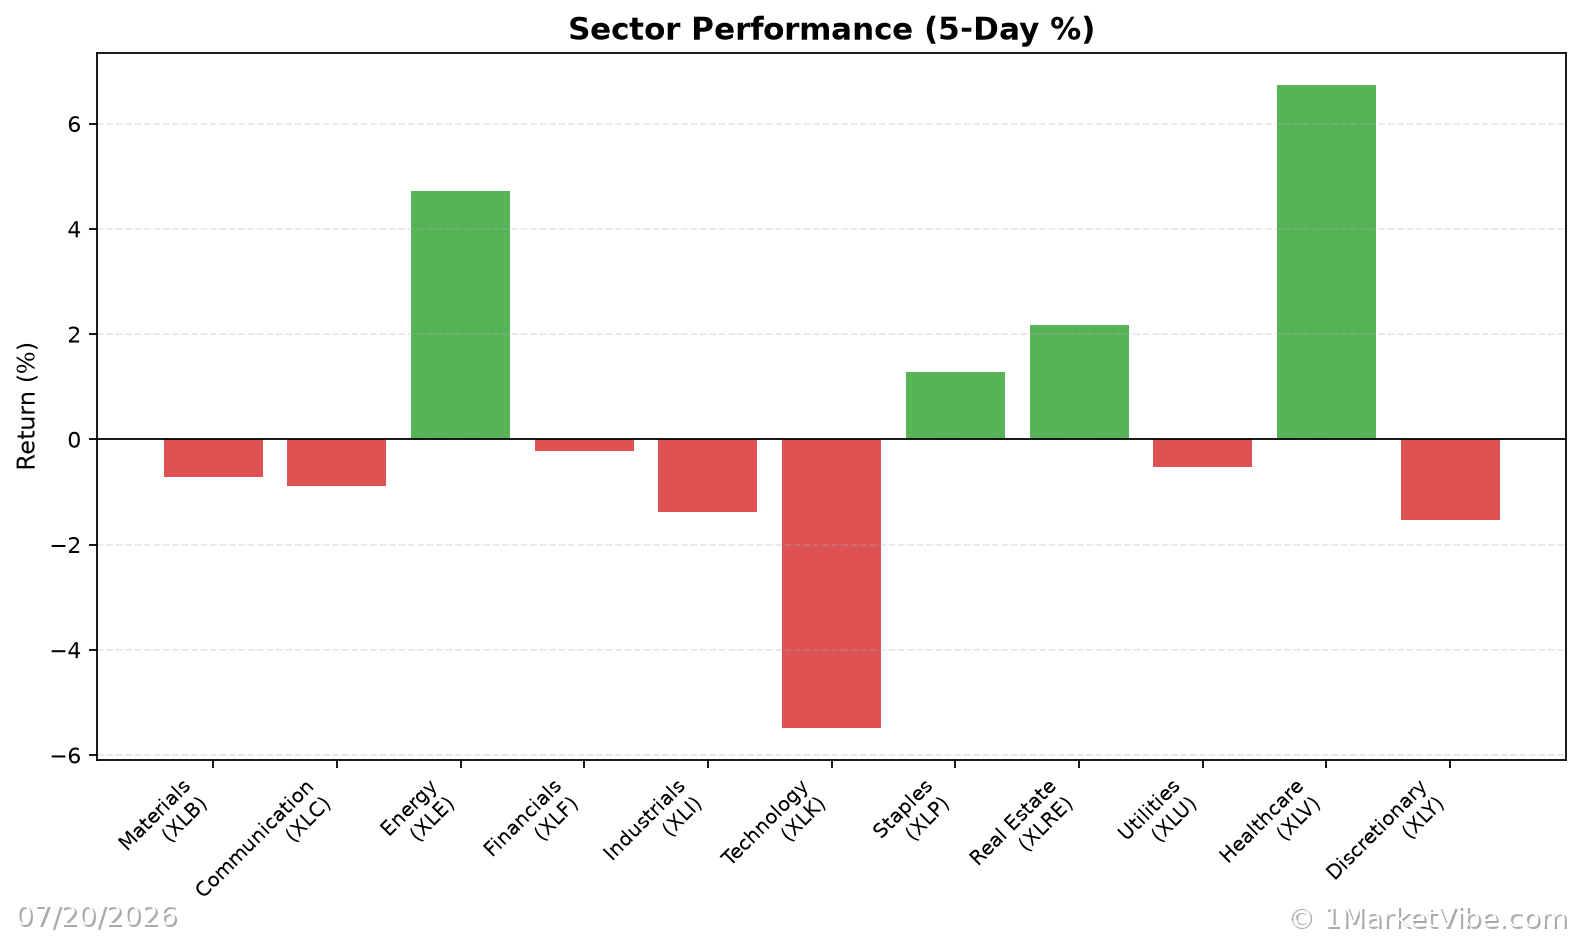
To see these breadth and risk metrics in one place each day, you can use the Decision Edge dashboard at 1marketvibe.com.
This article is for informational purposes only and should not be considered investment advice. Always conduct your own research and consult with a financial advisor before making investment decisions.