
Iran Conflict Drives Market Volatility as CW Index Indicates Rising Risk
- Authors

- Name
- MarketVibe Team
- @1marketvibe
Iran Conflict Drives Market Volatility as CW Index Indicates Rising Risk
In the midst of geopolitical tensions, such as the ongoing conflict involving Iran, financial markets often experience heightened volatility. This article will explore the Crash Warning Index (CWI), a key metric that helps traders assess risk levels during such turbulent times. Understanding the CWI can guide traders in making informed decisions about risk management and portfolio adjustments.
Orientation – What Are We Explaining?
The Crash Warning Index (CWI) is a composite metric that aggregates several dimensions of market risk, including breadth, volatility, and defensive behavior. Traders should care about the CWI because it provides an early warning of potential market corrections or crashes. By monitoring the CWI, traders can reduce blind spots related to market risk and adjust their strategies accordingly. It fits into a structured process by serving as a risk assessment tool rather than a standalone trading signal.
How It Works – Mechanics & Data
The CWI is constructed by combining various indicators that reflect market conditions:
- Breadth: Measures the proportion of stocks above their 50-day moving average, indicating the overall health of market trends.
- Volatility: Assessed through metrics like ATR% (Average True Range as a percentage of price), which captures market choppiness.
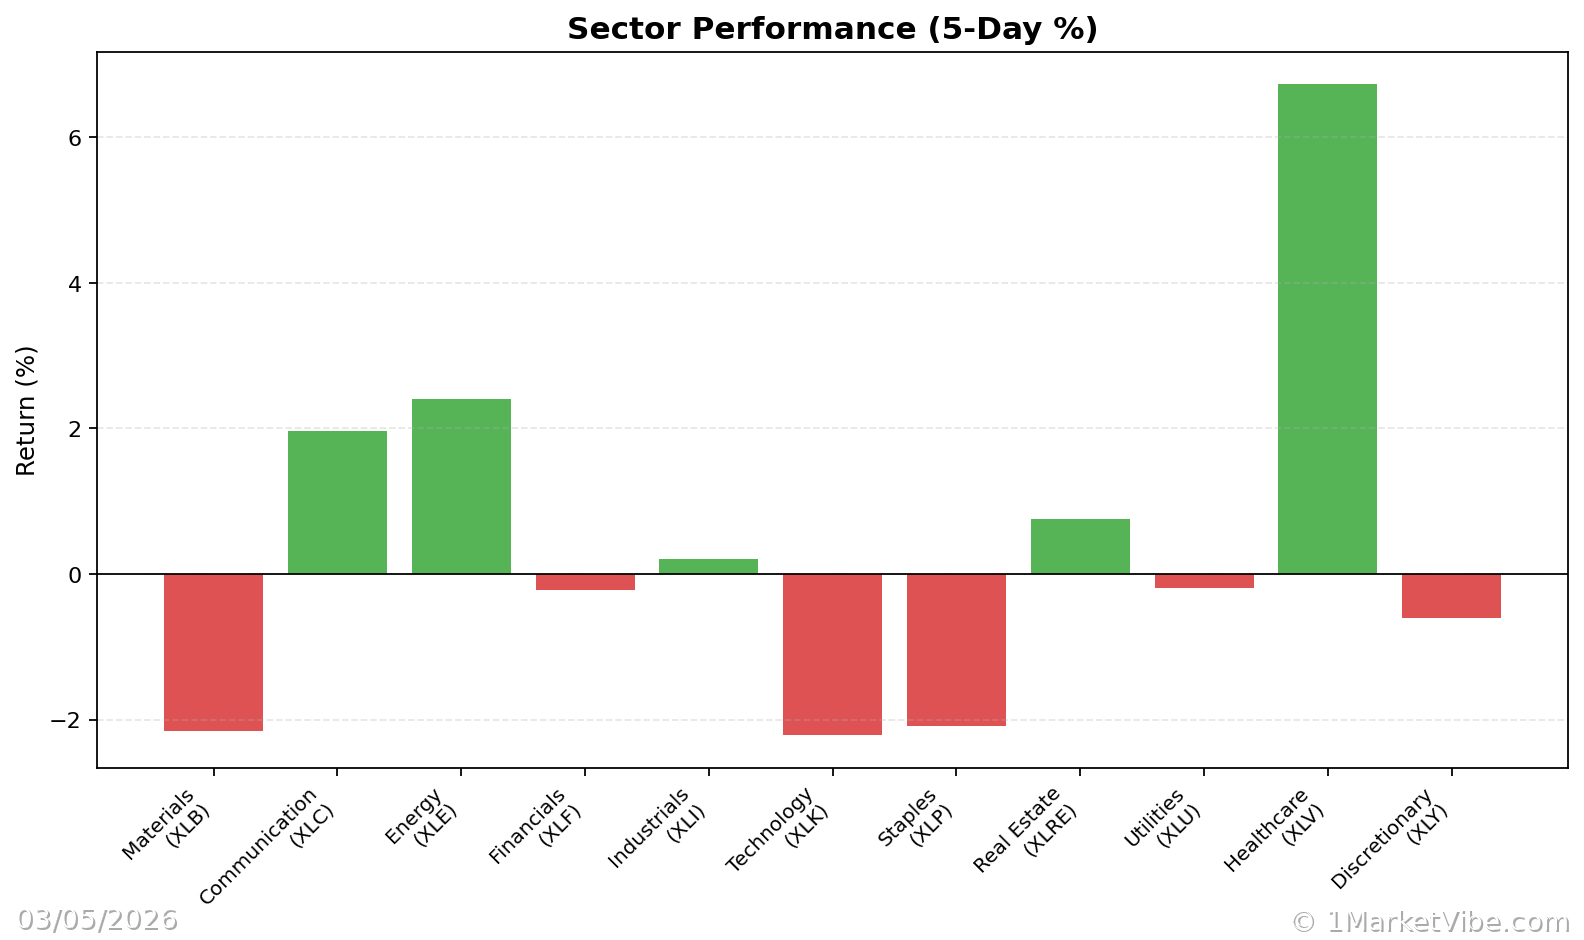
- Defensive Behavior: Observes the performance of defensive sectors, such as utilities and consumer staples, relative to the broader market.
The CWI moves based on changes in these underlying components. For instance, a surge in volatility or a decline in breadth can push the CWI higher, signaling increased market risk.
Interpretation – What Different Levels Tend to Mean
The CWI provides insights into market risk through its levels:
- Below 3: Indicates a relatively low-risk environment where market conditions are stable.
- Between 3 and 6: Suggests moderate risk, where traders should be cautious and monitor market developments closely.
- Above 6: Signals elevated risk, where the likelihood of market corrections increases, and defensive strategies may be warranted.
Common combinations of market conditions include:
- Weak Breadth + Rising Volatility: Often precedes market downturns, as seen in the current geopolitical climate.
- Strong Breadth + Low Volatility: Typically aligns with stable, bullish market phases.
Real-World Scenarios – How This Shows Up in Markets
Scenario 1: Topping Environment
In a topping environment, the CWI might rise above 6 as breadth deteriorates, even if major indices continue to grind higher. Traders might feel tempted to hold onto positions, expecting further gains. However, a more informed view would suggest reducing exposure and preparing for potential declines.
Scenario 2: Volatility Spike
During a volatility spike, such as those triggered by geopolitical events, the ATR% would jump, and the CWI would accelerate. Traders might panic and sell indiscriminately. Instead, understanding the CWI can help them focus on risk management and consider hedging strategies.
Scenario 3: Bull Market Leg
In a strong bull market leg, the % Above 50-DMA might surge, indicating robust breadth. The CWI would likely remain low, supporting increased exposure to equities. Traders should still ensure their setups align with their risk tolerance and market conditions.
How to Use This Insight in a Process
To incorporate the CWI into a trading process:
- When Breadth is Weak and CWI is High: Emphasize defensive strategies and reduce new risk exposure.
- When Breadth and Leadership Broaden: Be open to adding exposure, provided setups are favorable.
- Use the Market Dashboard: As a high-level regime label, then check internals for confirmation.
The CWI guides risk posture and expectations, helping traders align their strategies with prevailing market conditions.
Common Misuses & Misconceptions
Traders often misuse the CWI by:
- Treating it as a Standalone Entry Signal: The CWI should be part of a broader risk assessment, not a direct trading signal.
- Ignoring Context: Failing to consider sector rotation or time frames can lead to misinterpretation.
- Overreacting to One-Day Changes: The CWI is more reliable when viewed over several days or weeks.
A healthier approach involves integrating the CWI with other market indicators and maintaining a balanced perspective.
To see these breadth and risk metrics in one place each day, you can use the Decision Edge dashboard at 1marketvibe.com.
Disclaimer: This article is for informational purposes only and does not constitute financial advice. Market conditions can change rapidly, and traders should conduct their own research before making investment decisions.