Dow Futures Decline as Iran Tensions Indicate Upcoming Market Volatility
- Authors

- Name
- MarketVibe Team
- @1marketvibe
Dow Futures Decline as Iran Tensions Indicate Upcoming Market Volatility
Introduction
Recent geopolitical tensions between the U.S. and Iran have led to a notable decline in Dow futures, signaling potential volatility in the market. This situation underscores the importance of understanding how geopolitical events can influence market dynamics and highlights the relevance of MarketVibe's Crash Warning Index (CWI) in anticipating such shifts. In this article, we'll explore how these tensions are affecting the market, delve into the mechanics of the CWI, and discuss how traders can use this insight to better manage risk.
Market Reaction
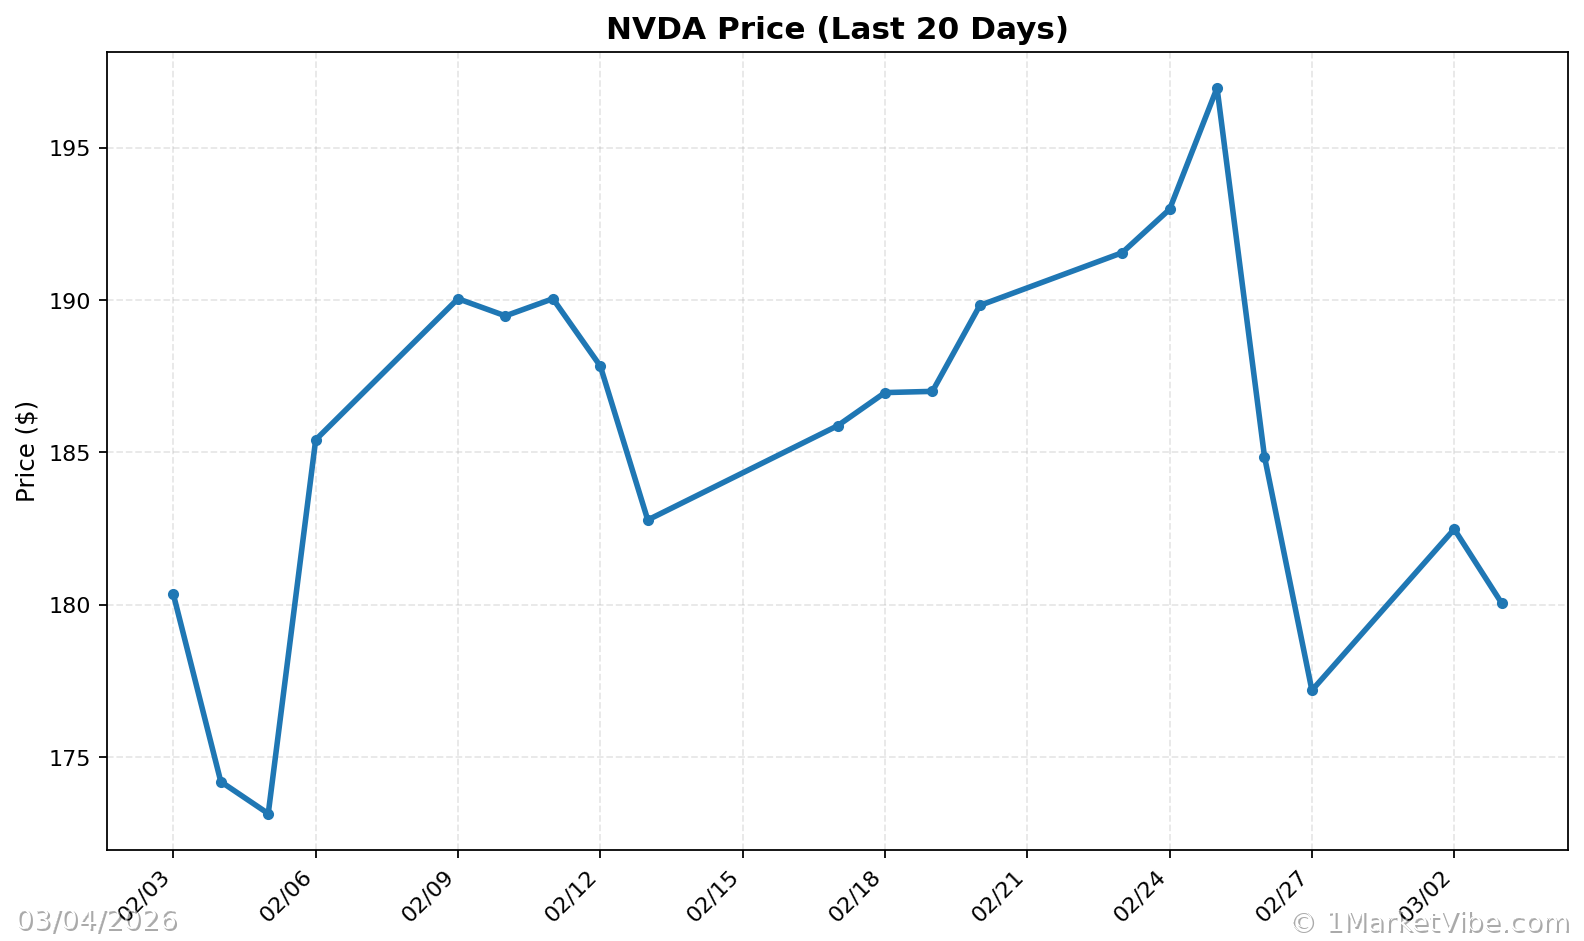
The Dow Jones futures have experienced a significant drop, reflecting heightened market volatility. This decline is partly driven by the broader uncertainty stemming from the U.S.-Iran conflict, which has disrupted global markets. Notably, Nvidia's stock performance has been a focal point amidst these shifts, illustrating how individual stocks can react differently to geopolitical events.
Oil Price Surge
The conflict has also led to a surge in oil prices, primarily due to concerns over the Strait of Hormuz, a critical chokepoint for global oil shipping. This increase in oil prices could have cascading effects on gas prices and consumer goods, further contributing to market volatility. Traders should be aware of how such macroeconomic factors can impact their portfolios.
Geopolitical Context
Understanding the historical context of the U.S.-Iran conflict is crucial for grasping its market implications. The Strait of Hormuz is a vital artery for oil transportation, and any disruption here can have significant global economic repercussions. This geopolitical backdrop adds another layer of complexity to market analysis.
CWI Index Insights
The Crash Warning Index (CWI) is a composite metric that evaluates several risk dimensions, including market breadth, volatility, and defensive behavior. Currently, the CWI stands at 7.0, indicating elevated risk levels. This index serves as an early warning system, often providing a 4-6 week lead time before potential market corrections.
How the CWI Works
The CWI is constructed by aggregating data from various market indicators. It considers the percentage of stocks above their 50-day moving averages, the advance-decline net (A/D Net), new highs versus new lows (NH–NL), and the average true range percentage (ATR%). Each of these components contributes to a comprehensive view of market health and risk.
- % Above 50-DMA: Measures the proportion of stocks trading above their 50-day moving averages, indicating trend strength.
- A/D Net: Gauges internal market strength by comparing advancing stocks to declining ones.
- NH–NL: Tracks the expansion or contraction of new highs and lows, reflecting market momentum.
- ATR%: Assesses volatility by measuring price movement relative to the stock's price.
Interpretation of CWI Levels
- CWI below 3: Generally indicates a stable market with low risk.
- CWI between 3 and 6: Suggests moderate risk, warranting cautious optimism.
- CWI above 6: Signals high risk, with increased likelihood of market corrections.
When the CWI is elevated, as it is now, traders should be prepared for potential volatility and consider defensive strategies.
Real-World Scenarios
Scenario 1: Topping Environment
Imagine a scenario where the market index continues to rise, but the breadth deteriorates. The % Above 50-DMA might decline, while the CWI increases, signaling underlying weakness. Traders might feel tempted to chase the rally, but a more informed approach would be to reduce exposure and wait for confirmation of strength.
Scenario 2: Bullish Breakout
In a strong new bull leg, the % Above 50-DMA surges and remains high, while the CWI stays low. This combination suggests a robust market environment, encouraging traders to increase exposure, provided their setups align with market conditions.
Scenario 3: Volatility Spike
During a geopolitical event, ATR% might spike, and the CWI could rise sharply. This indicates heightened volatility and risk, prompting traders to tighten risk controls and consider hedging strategies.
How to Use This Insight in a Process
- Defensive Posture: When the CWI is high, prioritize risk management by reducing new risk and focusing on defensive sectors.
- Opportunistic Exposure: In environments with strong breadth and low CWI, be open to adding exposure if setups are favorable.
- Dashboard Confirmation: Use the MarketVibe Decision Edge dashboard to get a high-level view of market regimes and confirm insights with internal metrics.
Common Misuses & Misconceptions
- Standalone Signal: Avoid using the CWI as a sole entry or exit signal. It should be part of a broader analysis framework.
- Ignoring Context: Consider sector rotation and time frame when interpreting the CWI. Context matters.
- Overreacting to One-Day Changes: Focus on trends rather than daily fluctuations to avoid knee-jerk reactions.
To see these breadth and risk metrics in one place each day, you can use the Decision Edge dashboard at 1marketvibe.com.
This article is for informational purposes only and does not constitute financial advice. Please consult with a financial advisor before making any investment decisions.
Charts