Impact of Trump's Federal Reserve Appointment on Gold Markets
- Authors

- Name
- MarketVibe Team
- @1marketvibe
Impact of Trump's Federal Reserve Appointment on Gold Markets
1. Orientation – What Are We Explaining?
In this article, we explore the impact of President Trump's appointment of Kevin Warsh as the new chair of the Federal Reserve on the gold markets. This event is significant because it highlights the intersection of political influence and market dynamics, particularly in the precious metals sector. Understanding this impact is crucial for traders who use MarketVibe's metrics to navigate market risks and opportunities.
Traders should care about this development because it affects market sentiment and volatility, which are key components of MarketVibe's metrics like the Crash Warning Index (CWI) and ATR%. These metrics help traders make informed decisions by providing insights into market risk conditions and volatility regimes. By understanding how political events influence these metrics, traders can better anticipate market movements and adjust their strategies accordingly.
2. How It Works – Mechanics & Data
The Crash Warning Index (CWI) is a composite metric that aggregates several dimensions of market risk, including breadth, volatility, and defensive behavior. It provides an early warning signal for potential market corrections. A CWI reading above 6 indicates elevated risk, suggesting that traders should be cautious about taking on new positions.
The ATR%, or Average True Range percentage, measures market volatility relative to price. High ATR% values indicate increased volatility, which often corresponds to unstable or choppy market conditions. Conversely, low ATR% values suggest quieter, trending phases.
In the context of Trump's appointment, the CWI is currently at 5.9, signaling heightened risk. This reading reflects the market's reaction to potential changes in Federal Reserve policy under Warsh's leadership, which could affect interest rates and, consequently, gold prices.
3. Interpretation – What Different Levels Tend to Mean
CWI Ranges:
- Below 3: Low risk, generally stable market conditions.
- 3 to 6: Moderate risk, potential for increased volatility.
- Above 6: High risk, corrections become more likely.
ATR% Ranges:
- Below 1%: Low volatility, stable trends.
- 1% to 2%: Moderate volatility, potential for trend changes.
- Above 2%: High volatility, choppy or unstable market conditions.
When the CWI is high and ATR% is elevated, it suggests a volatile market environment where traders should emphasize risk management and consider defensive strategies.
4. Real-World Scenarios – How This Shows Up in Markets
Scenario 1: Topping Environment
- Metrics: CWI at 5.9, ATR% at 2.5%
- Market Behavior: Gold prices drop as traders anticipate tighter monetary policy under Warsh.
- Trader Temptation: Panic sell or overreact to price swings.
- Informed Response: Reduce exposure to high-risk assets, focus on defensive sectors.
Scenario 2: Bull Leg Initiation
- Metrics: % Above 50-DMA surges, CWI drops below 3
- Market Behavior: Gold prices stabilize and begin to rise as market confidence in Warsh's independence grows.
- Trader Temptation: Rush to buy without confirmation.
- Informed Response: Gradually increase exposure as setups align with broader market strength.
Scenario 3: Volatility Spike
- Metrics: ATR% jumps to 3%, CWI remains high
- Market Behavior: Sharp fluctuations in gold prices due to uncertainty about Fed policy.
- Trader Temptation: Chase volatile moves.
- Informed Response: Use hedging strategies to manage risk, avoid over-leveraging.
5. How to Use This Insight in a Process
- Risk Management: When CWI is high and ATR% indicates volatility, prioritize capital preservation and reduce new risk exposure.
- Exposure Adjustment: As breadth and leadership improve, consider increasing exposure, but only if market conditions support your trading setups.
- Dashboard Utilization: Use the Market Dashboard to assess the overall market regime and confirm insights from individual metrics.
6. Common Misuses & Misconceptions
- Standalone Signal Misuse: Treating CWI or ATR% as a sole entry signal can lead to poor timing. Always consider the broader market context.
- Ignoring Context: Focusing solely on gold without considering sector rotation or macroeconomic factors can lead to misinformed decisions.
- Overreacting to Daily Changes: Reacting to one-day metric shifts can cause unnecessary trading. Focus on trends and sustained signals.
To see these breadth and risk metrics in one place each day, you can use the Decision Edge dashboard at 1marketvibe.com.
This article is for informational purposes only and should not be considered financial advice. Always conduct your own research or consult a financial advisor before making investment decisions.
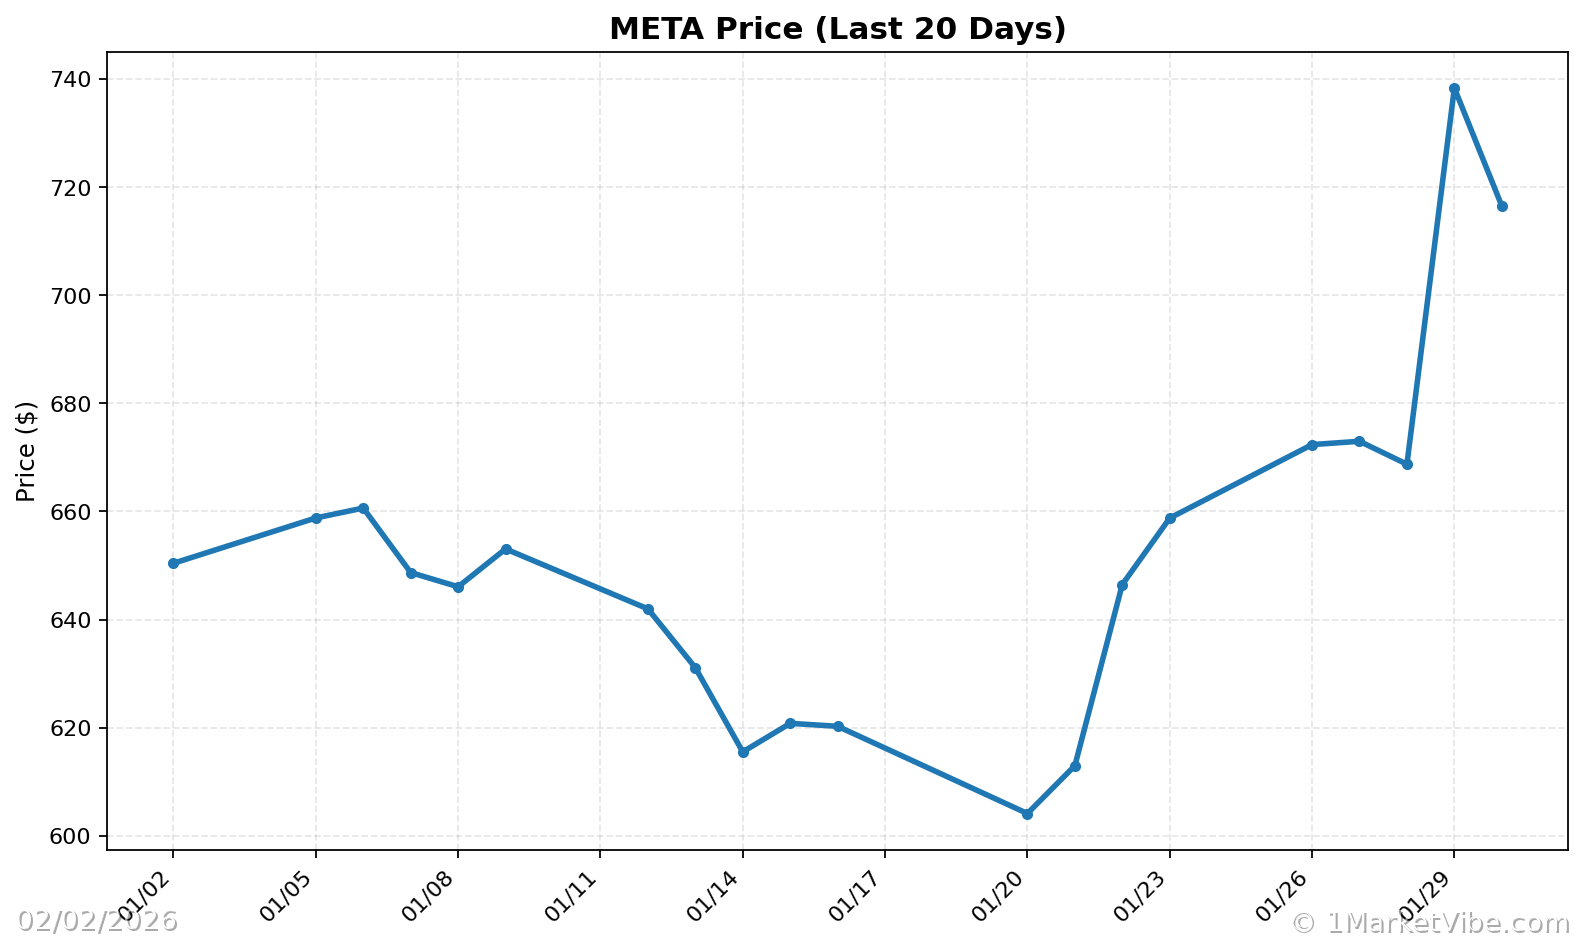
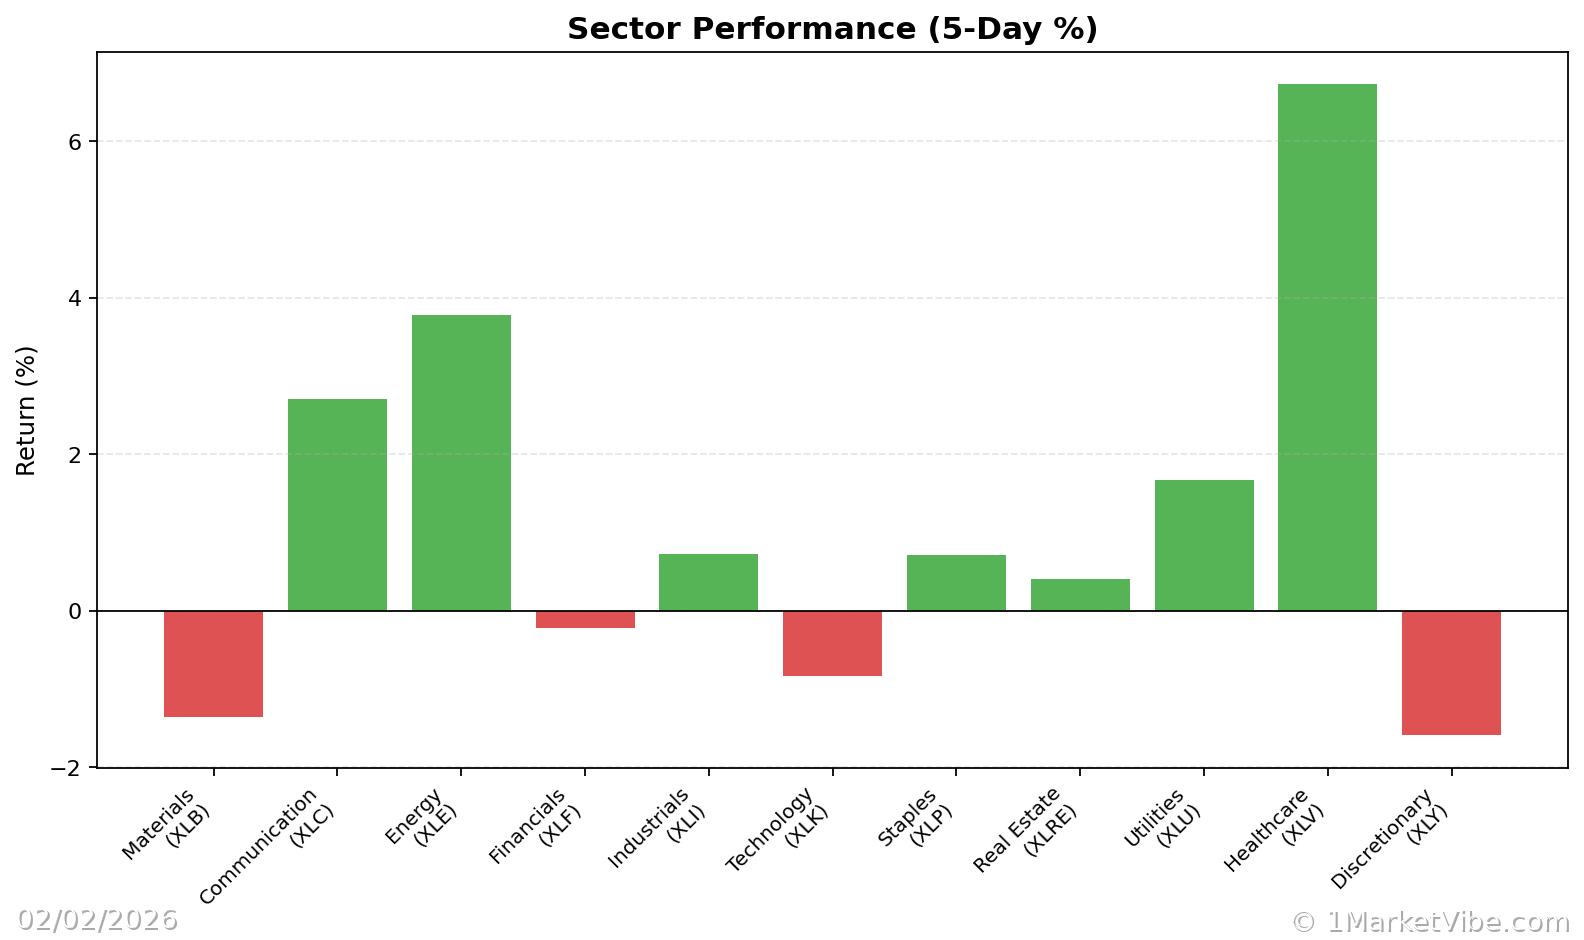
Charts