
Fed Maintains Interest Rates as CW Index Indicates Stable Economic Outlook
- Authors

- Name
- MarketVibe Team
- @1marketvibe
Fed Maintains Interest Rates as CW Index Indicates Stable Economic Outlook
The Federal Reserve's recent decision to maintain interest rates has been met with a sense of stability in the economic landscape. This decision aligns with the current reading of MarketVibe's Crash Warning Index (CWI), which stands at 6.0, indicating a stable economic outlook. In this article, we'll explore the significance of the CWI, how it is constructed, and how traders can use this information to make informed decisions.
Understanding the Crash Warning Index (CWI)
The Crash Warning Index (CWI) is a composite metric designed to provide an early warning of potential market corrections or crashes. It integrates various dimensions of market risk, including breadth, volatility, and defensive behavior. Traders should care about the CWI because it helps inform risk management decisions, reduces blind spots related to market stability, and fits into a structured process of evaluating market conditions rather than acting as a standalone signal.
How the CWI Works
The CWI is constructed by analyzing several key market indicators:
- Breadth: Measures the number of stocks advancing versus declining. A healthy market typically shows a higher number of advancing stocks.
- Volatility: Assessed through metrics like the Average True Range (ATR%), which measures price volatility relative to the stock's price.
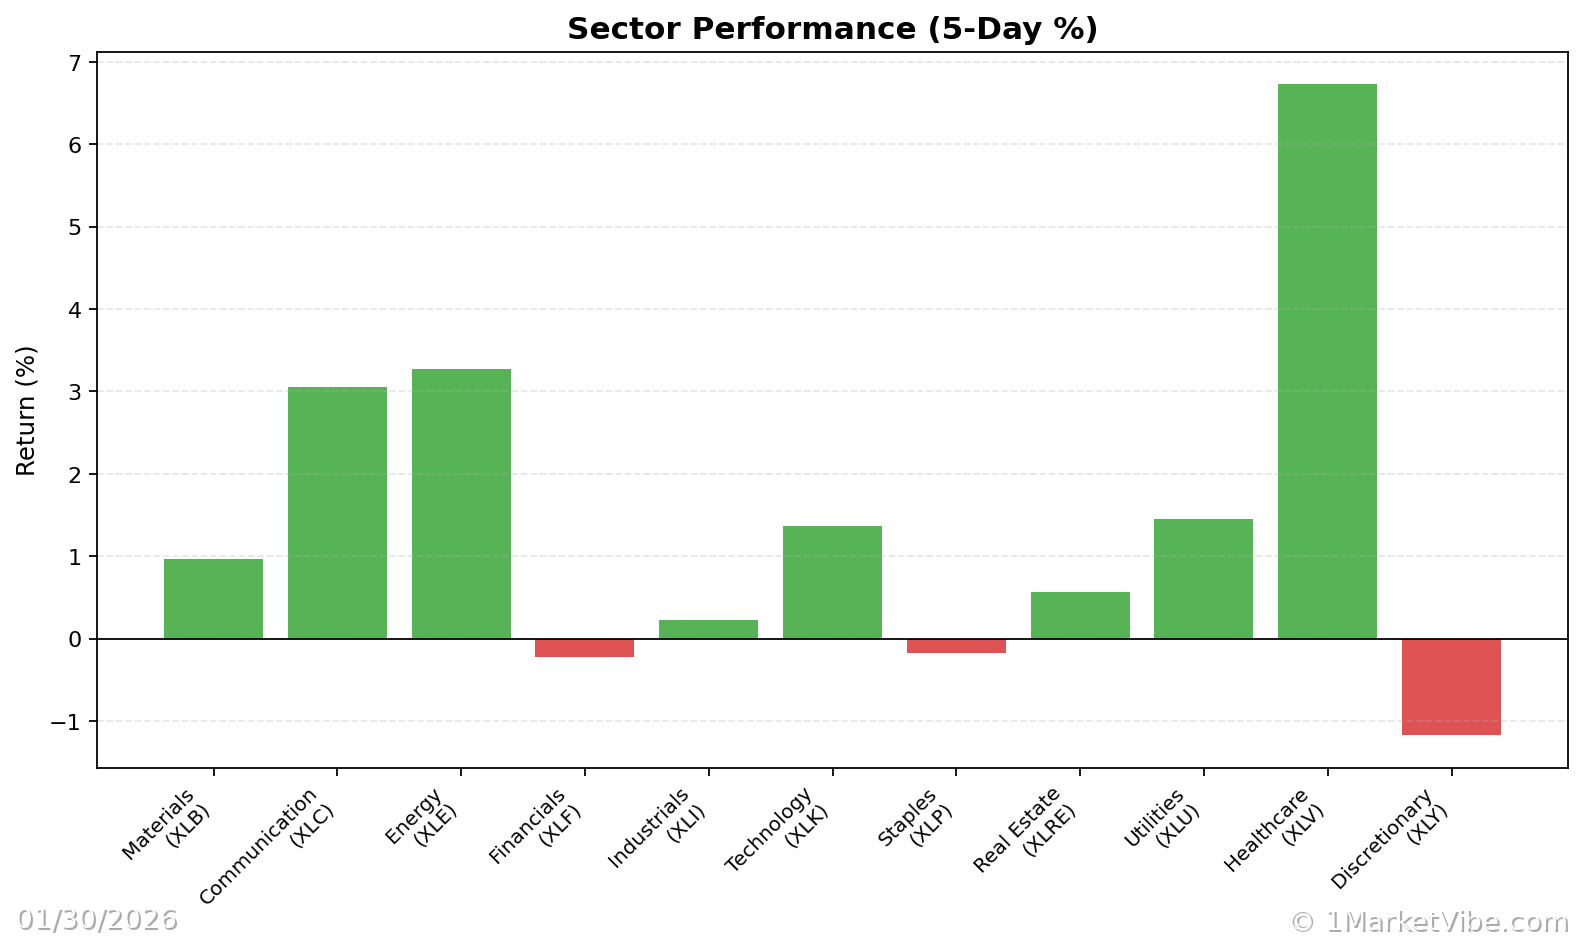
- Defensive Behavior: Observes the performance of defensive sectors like utilities and consumer staples compared to more aggressive sectors like technology and consumer discretionary.
The CWI moves based on changes in these underlying components. For example, if market breadth weakens significantly while volatility rises, the CWI may increase, signaling heightened risk.
Interpreting CWI Levels
- Below 3: Indicates a low-risk environment where markets are generally stable.
- Between 3 and 6: Suggests a moderate risk level, where caution is advised but not urgent.
- Above 6: Signals elevated risk, where market corrections become more likely.
When the CWI is at 6.0, as it currently is, it suggests that the market is stable but warrants close monitoring for any shifts that could increase risk.
Real-World Scenarios
Scenario 1: Topping Environment
Imagine a scenario where the market index continues to rise, but the breadth deteriorates. The CWI might increase as fewer stocks participate in the rally, indicating potential underlying weakness. Traders might feel tempted to chase the rally, but a more informed view would suggest caution and possibly reducing exposure.
Scenario 2: Strong Bull Leg
In a strong new bull market leg, the % Above 50-DMA might surge, indicating robust market health. The CWI would likely remain low, supporting a more aggressive risk posture. Traders can consider increasing exposure, provided their setups align with this broader market strength.
Scenario 3: Volatility Spike
During a market sell-off, the ATR% might spike, reflecting increased volatility. The CWI could accelerate, warning of elevated risk. Traders might be tempted to panic sell, but a better approach would be to reassess risk exposure and consider hedging strategies.
Incorporating CWI into Your Trading Process
Practical Guidelines
- When CWI is High: Emphasize defensive strategies, reduce new risk, and consider hedging positions. This is not the time for aggressive risk-taking.
- When CWI is Low: Be open to adding exposure, especially if market breadth and leadership are strong. Ensure your setups are robust and align with the broader market trend.
- Use Market Dashboard: Leverage MarketVibe's Decision Edge Dashboard to get a high-level view of market regimes and confirm insights with internal metrics.
Common Misuses & Misconceptions
- Standalone Signal: Some traders mistakenly treat the CWI as a direct trading signal. Instead, use it as a guide for risk posture.
- Ignoring Context: It's crucial to consider sector rotation and broader market conditions. The CWI should be part of a holistic analysis.
- Overreacting to Daily Changes: The CWI is more valuable as a trend indicator rather than reacting to daily fluctuations.
Conclusion
The Federal Reserve's decision to maintain interest rates aligns with the stable reading of the CWI at 6.0, suggesting a secure economic outlook. By understanding and integrating the CWI into their trading process, traders can better navigate market conditions and make more informed decisions.
To see these breadth and risk metrics in one place each day, you can use the Decision Edge dashboard at 1marketvibe.com.
Disclaimer: This article is for informational purposes only and does not constitute financial advice. Always consult with a financial advisor before making investment decisions.