
Gold Reaches $5,000 as CW Index Highlights Safe Haven Trend
- Authors

- Name
- MarketVibe Team
- @1marketvibe
Gold Reaches $5,000 as CW Index Highlights Safe Haven Trend
In recent weeks, gold has surged past $5,000 per ounce, capturing the attention of traders and investors worldwide. This significant milestone underscores the metal's role as a safe-haven asset, particularly during periods of heightened market uncertainty. A key factor in this trend is the Crash Warning Index (CWI), which has been signaling increased risk in the broader market environment. Understanding how the CWI operates and its implications can provide valuable insights for traders looking to navigate these turbulent times.
Understanding the Crash Warning Index (CWI)
The Crash Warning Index (CWI) is a composite metric designed to gauge the underlying risk in the financial markets. It combines several dimensions of market behavior, including breadth, volatility, and defensive sector performance, to provide a comprehensive risk assessment. Traders should pay attention to the CWI because it helps inform decisions about risk management and portfolio adjustments, reducing blind spots that might arise from focusing solely on price movements.
How the CWI Works
The CWI is constructed by analyzing various market indicators:
- Breadth: This involves measuring the percentage of stocks trading above their 50-day moving averages. A decline in this percentage often signals weakening market internals.
- Volatility: The Average True Range (ATR%) is used to assess market volatility relative to price. High ATR% indicates increased market turbulence.
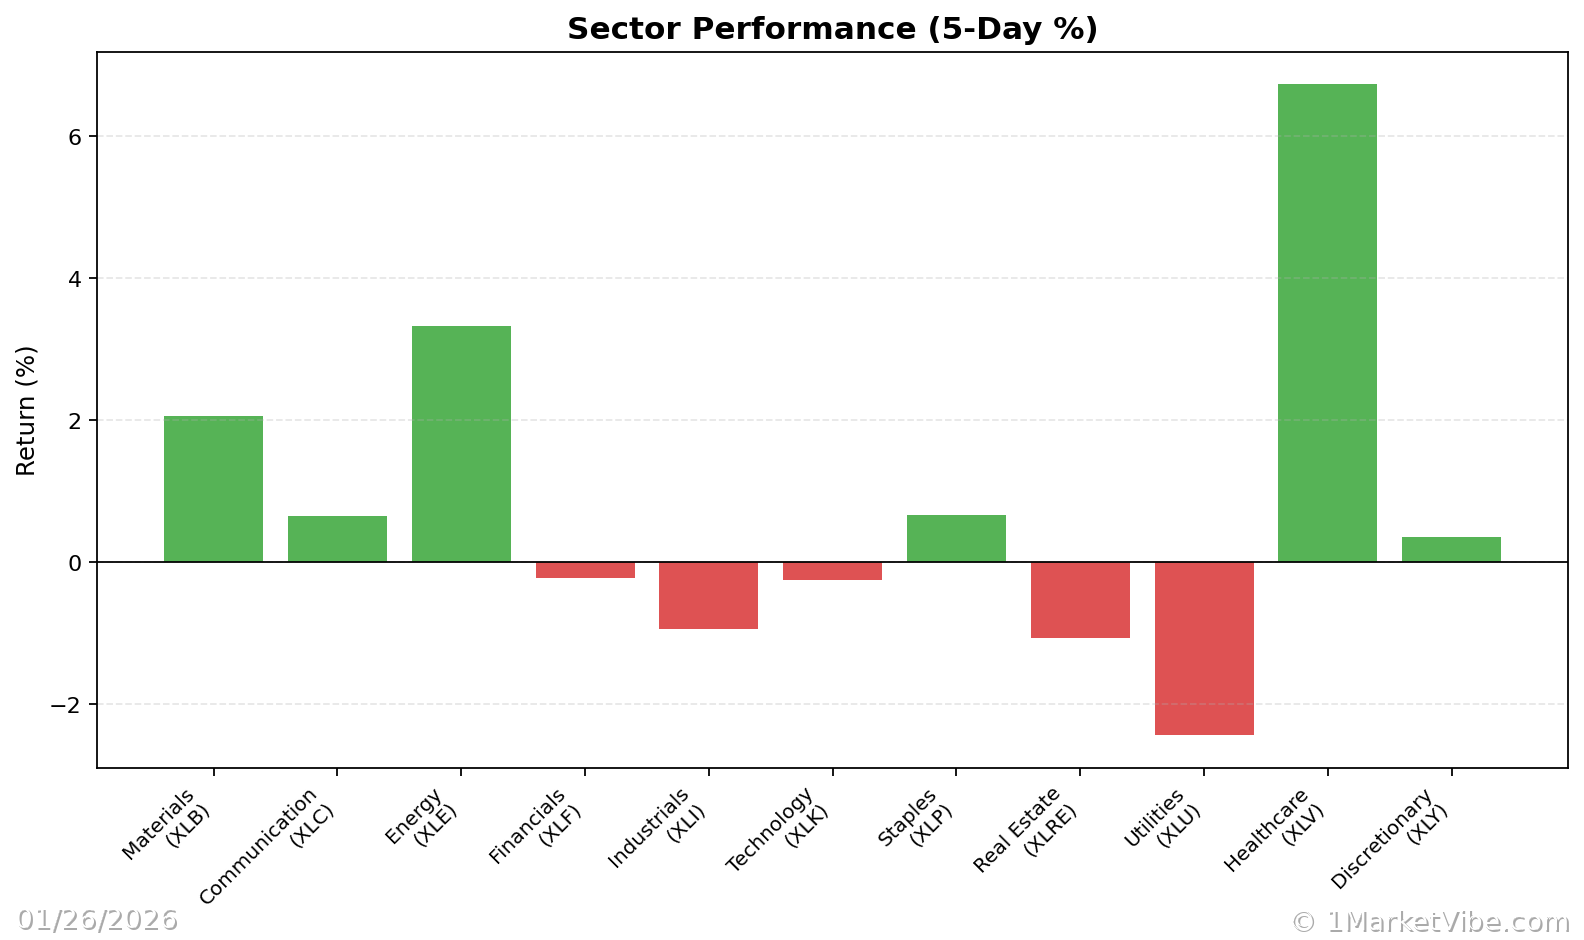
- Defensive Behavior: The performance of defensive sectors, such as utilities and consumer staples, is monitored. A shift towards these sectors often suggests a risk-off environment.
The CWI moves day-to-day based on changes in these underlying components. For example, a broad market sell-off that increases volatility and shifts investor interest towards defensive sectors would likely push the CWI higher.
Interpreting CWI Levels
CWI Ranges and Implications:
- Below 3: Generally indicates a stable, low-risk environment where risk-taking is more favorable.
- Between 3 and 6: Suggests moderate risk, warranting cautious optimism and selective exposure.
- Above 6: Signals elevated risk, where corrections become more likely, and defensive strategies are advisable.
In the current scenario, the CWI reading of 5.8 reflects moderate risk, aligning with the surge in gold prices as investors seek safe-haven assets.
Real-World Scenarios
Scenario 1: A Topping Market
Imagine a scenario where major indices are reaching new highs, but the percentage of stocks above their 50-DMA is declining. The CWI might rise to around 5.5, indicating underlying weakness despite the index levels. Traders might feel tempted to chase the rally, but a more informed view would suggest caution and possibly reducing exposure.
Scenario 2: A New Bull Leg
Consider a market where the % Above 50-DMA surges past 70% and remains elevated, while the CWI drops below 3. This environment suggests strong market breadth and low risk, encouraging traders to increase exposure, provided their setups align with this broader trend.
Scenario 3: Volatility Spike
In a situation where geopolitical tensions or economic data surprises lead to a volatility spike, the ATR% would rise sharply, and the CWI might climb above 6. This would indicate a high-risk environment, prompting traders to tighten stop losses and consider hedging strategies.
Incorporating CWI Insights into Your Process
To effectively use the CWI in your trading process, consider the following guidelines:
- Emphasize Defense When Risk is High: When the CWI is above 6, prioritize capital preservation by reducing new risk and focusing on defensive sectors.
- Broaden Exposure with Strong Breadth: If the CWI is low and market breadth is strong, be more open to adding exposure, but ensure your setups are robust.
- Use Market Dashboard for Context: The Decision Edge Dashboard provides a high-level view of market regimes. Use it to confirm the CWI's signals and adjust your risk posture accordingly.
Common Misuses and Misconceptions
Traders often misuse the CWI by:
- Treating it as a Stand-Alone Signal: The CWI should not be used in isolation. Always consider it alongside other market indicators and your trading strategy.
- Ignoring Context: Failing to account for sector rotation or broader economic factors can lead to misguided decisions.
- Overreacting to Daily Changes: The CWI is more valuable for identifying trends rather than reacting to short-term fluctuations.
A healthier approach is to integrate the CWI into a comprehensive risk management framework, using it to guide overall risk posture rather than precise entry or exit points.
To see these breadth and risk metrics in one place each day, you can use the Decision Edge dashboard at 1marketvibe.com.
Disclaimer: This article is for informational purposes only and does not constitute financial advice. Please consult with a financial advisor before making any investment decisions.