
CW Index at 5.5 and the Potential Rally of Asian Stocks
- Authors

- Name
- MarketVibe Team
- @1marketvibe
CW Index at 5.5 and the Potential Rally of Asian Stocks
1. Orientation – What Are We Explaining?
In this article, we will explore the Crash Warning Index (CWI), which currently stands at 5.5, and its implications for a potential rally in Asian stocks. The CWI is a composite metric designed to provide early warnings of elevated market risk, combining several dimensions such as market breadth, volatility, and defensive behavior. Understanding the CWI can help traders make informed decisions about risk management and position sizing, reducing blind spots in their market analysis.
2. How It Works – Mechanics & Data
The Crash Warning Index (CWI) is constructed by aggregating various risk indicators, including:
- Market Breadth: Measures like the percentage of stocks above their 50-day moving average (% Above 50-DMA) to assess trend health.
- Volatility: Metrics such as Average True Range Percentage (ATR%) to gauge market stability.
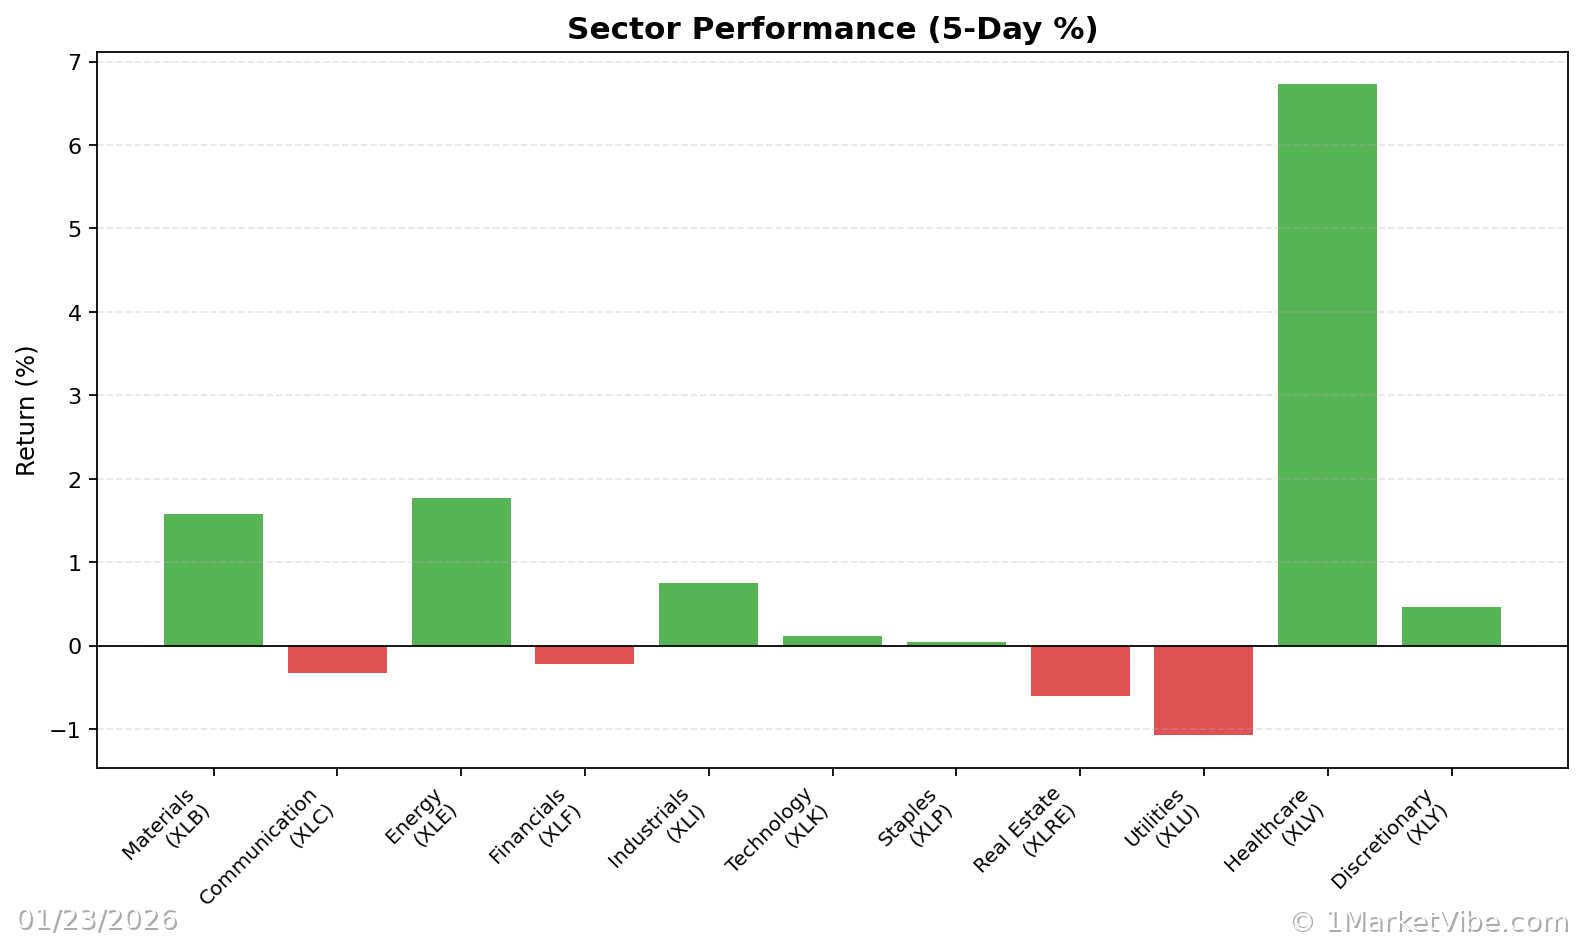
- Defensive Behavior: Observations of sector rotations into traditionally defensive sectors like utilities or consumer staples.
The CWI is sensitive to changes in these underlying components. For example, a sharp decline in breadth or a spike in volatility can push the CWI higher. Conversely, improvements in these areas can lower the CWI, indicating reduced risk.
3. Interpretation – What Different Levels Tend to Mean
The CWI is typically interpreted in ranges:
- Below 3: Low risk, suggesting a stable market environment.
- 3 to 6: Moderate risk, where caution is advised as market conditions could shift.
- Above 6: High risk, where corrections are more likely, and defensive strategies should be considered.
When the CWI is at 5.5, as it is currently, it indicates moderate risk. This suggests that while the market is not in immediate danger, traders should remain vigilant and possibly adjust their risk exposure.
4. Real-World Scenarios – How This Shows Up in Markets
Scenario 1: Topping Environment
Imagine a scenario where major indices are reaching new highs, but the % Above 50-DMA is declining. This divergence could cause the CWI to rise, signaling that despite the index gains, underlying market health is weakening. Traders might be tempted to chase the rally, but a more informed approach would be to tighten stops and consider reducing exposure.
Scenario 2: Bullish Breakout
In a strong bull market, the % Above 50-DMA might surge, and volatility could remain low, keeping the CWI below 3. This environment supports risk-taking, and traders could look to increase their exposure, assuming their setups align with this broader market strength.
Scenario 3: Volatility Spike
A sudden geopolitical event could cause a spike in ATR%, pushing the CWI above 6. In such cases, traders might feel panic, but a disciplined response would involve reassessing risk levels, possibly hedging positions, and avoiding impulsive trades.
5. How to Use This Insight in a Process
To integrate the CWI into your trading process:
- When the CWI is high (above 6), focus on defense. This might involve reducing position sizes, increasing cash holdings, or using options to hedge.
- In moderate risk environments (CWI between 3 and 6), maintain a balanced approach. Be selective with new positions and monitor market internals closely.
- When the CWI is low, be more open to increasing exposure, but always ensure that your trades align with your strategy and risk tolerance.
Use the Market Dashboard as a high-level regime label, then check internals for confirmation. This structured approach helps manage expectations and guides risk posture rather than precise timing.
6. Common Misuses & Misconceptions
Here are some common pitfalls to avoid with the CWI:
- Treating it as a stand-alone entry signal: The CWI is not a timing tool. Use it to gauge risk, not to time entries or exits.
- Ignoring context: Always consider sector rotations and broader market conditions. The CWI should be part of a comprehensive analysis.
- Overreacting to one-day changes: The CWI is more meaningful over several days. Avoid making drastic decisions based on short-term fluctuations.
To see these breadth and risk metrics in one place each day, you can use the Decision Edge dashboard at 1marketvibe.com.
Disclaimer: This article is for educational purposes only and does not constitute financial advice. Trading involves risk, and you should consult with a financial advisor before making any investment decisions.