

Ferrari's Stock Declines 8%: Insights from the Luce Launch
- Authors

- Name
- MarketVibe Team
- @1marketvibe
Understanding Ferrari's Stock Decline: Insights from the Luce Launch
Ferrari's recent unveiling of the Luce, a new electric vehicle, has sparked significant attention—not all of it positive. The launch of this $640,000 electric car has coincided with an 8% decline in Ferrari's stock price, raising questions about market reactions and the broader implications for luxury car manufacturers. In this article, we'll explore the factors behind this stock movement and use MarketVibe's metrics to gain deeper insights into the market dynamics at play.
Orientation: The Importance of Market Metrics
Before diving into the specifics of Ferrari's situation, it's crucial to understand the tools traders use to interpret such market events. MarketVibe offers several key metrics that help traders assess market conditions:
- Crash Warning Index (CWI): A composite measure indicating elevated risk levels.
- % Above 50-DMA: A breadth indicator showing the percentage of stocks trading above their 50-day moving average.
- ATR% (Average True Range Percentage): A volatility measure indicating price movement relative to price.
- A/D Net (Advance/Decline Net): A gauge of internal market strength.
- NH–NL (New High–New Low): A measure of market expansion or contraction.
These metrics help traders make informed decisions by providing a structured view of market health, risk, and potential turning points.
How It Works: MarketVibe Metrics in Action
Crash Warning Index (CWI)
The CWI is a composite index that combines several risk dimensions, including breadth, volatility, and defensive behavior. When the CWI rises above certain thresholds (e.g., 6), it signals elevated risk and a higher likelihood of market corrections. For instance, if Ferrari's stock decline is part of a broader market trend, a rising CWI could indicate systemic risk factors at play.
% Above 50-DMA
The % Above 50-DMA measures the proportion of stocks trading above their 50-day moving average. This metric provides insights into market breadth and trend health. A low percentage suggests a weak or oversold market, while a high percentage indicates strength and potential for upward momentum.
ATR% (Average True Range Percentage)
ATR% quantifies volatility by measuring price movement relative to price. High ATR% values often correspond to choppy or unstable market phases, while low values indicate quiet, trending periods. In the context of Ferrari's stock, a spike in ATR% could reflect increased volatility following the Luce launch.
Interpretation: What Different Levels Mean
- CWI Above 6: Indicates elevated risk and potential for market corrections.
- % Above 50-DMA Below 40%: Suggests a weak market environment, often seen during downturns.
- High ATR%: Signals increased volatility, which can accompany major news events or market shifts.
Combining these metrics provides a comprehensive view of market conditions. For example, weak breadth combined with high volatility often points to a challenging trading environment, where defensive strategies might be more appropriate.
Real-World Scenarios: Market Reactions to Ferrari's Luce Launch
Scenario 1: Weak Breadth and Rising Volatility
Imagine a market where the % Above 50-DMA is below 40%, indicating weak breadth, and the ATR% is rising. In such a scenario, traders might feel tempted to sell off positions in anticipation of further declines. However, a more informed approach would involve assessing the broader market context and considering defensive strategies.
Scenario 2: Strong Breadth with Low Volatility
Conversely, if the % Above 50-DMA is above 60% and ATR% is low, it suggests a strong, trending market. In this environment, traders might be more open to adding exposure, provided their setups align with market conditions.
How to Use This Insight in a Process
To effectively incorporate these insights into your trading process:
- Monitor MarketVibe Metrics: Use the Decision Edge dashboard to track key metrics like CWI and % Above 50-DMA.
- Adjust Risk Exposure: In environments with high CWI and weak breadth, consider reducing risk and focusing on defensive sectors.
- Stay Informed: Regularly review market internals to confirm or challenge your market view.
Common Misuses & Misconceptions
Traders often misuse these metrics by:
- Treating Them as Stand-Alone Signals: Metrics should guide risk posture, not dictate specific trades.
- Ignoring Context: Always consider sector rotation and broader market trends.
- Overreacting to One-Day Changes: Focus on sustained trends rather than daily fluctuations.
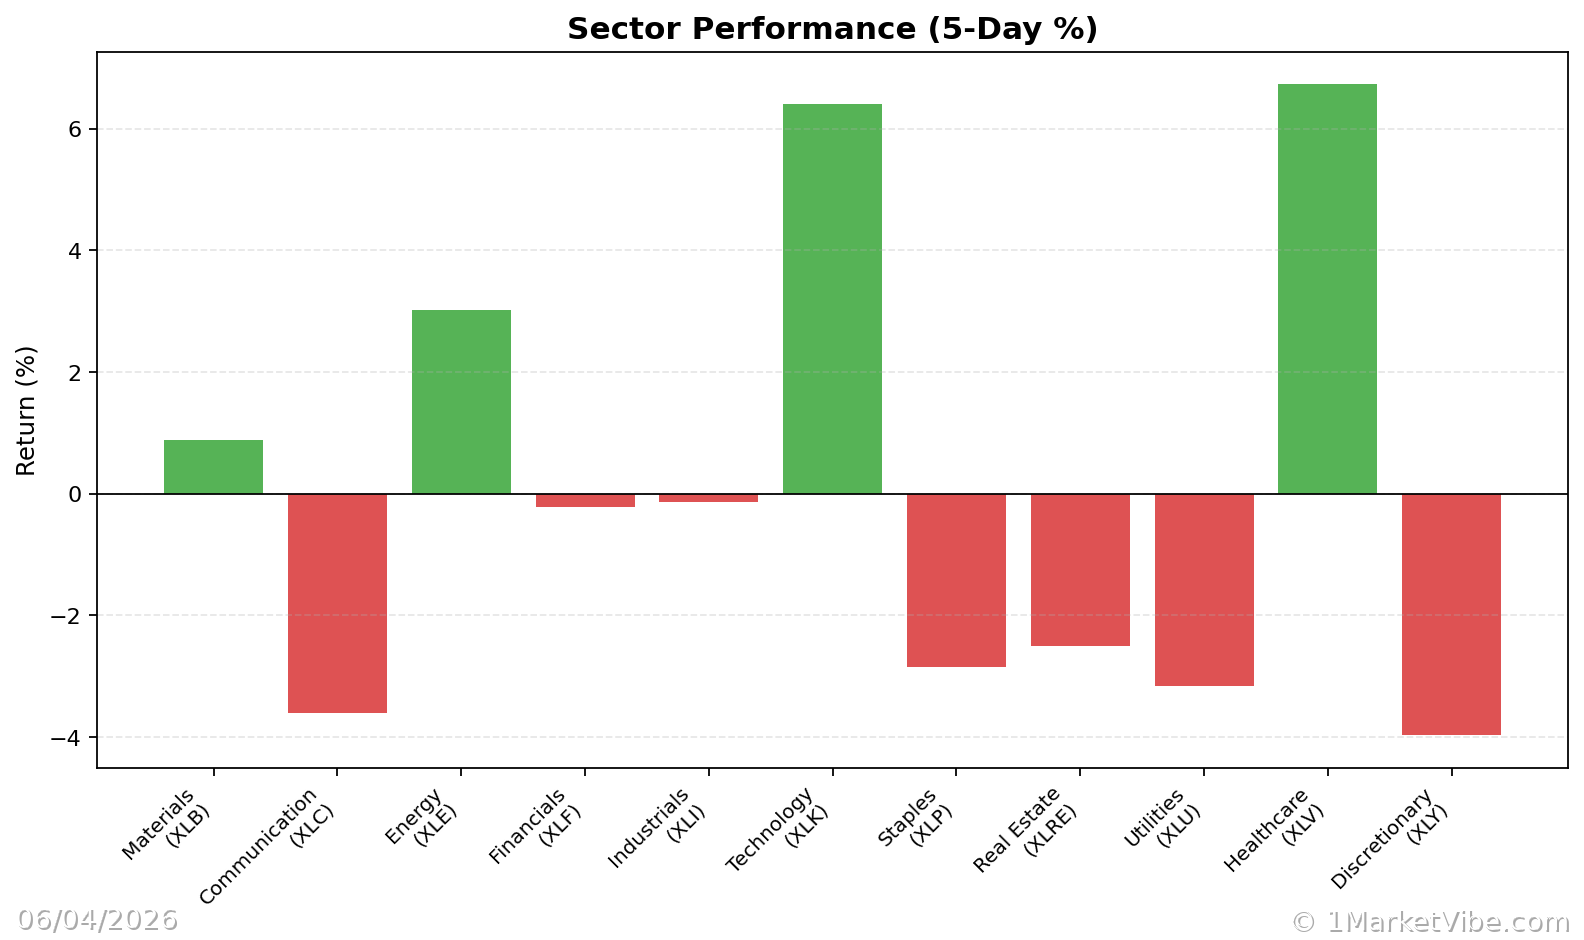
By understanding these common pitfalls, traders can better leverage MarketVibe's tools to enhance their decision-making processes.
To see these breadth and risk metrics in one place each day, you can use the Decision Edge dashboard at 1marketvibe.com.
Disclaimer: This article is for informational purposes only and should not be considered financial advice. Always conduct your own research before making investment decisions.