

Stock Futures Decline Amid Hidden Risks of Record Market Highs
- Authors

- Name
- MarketVibe Team
- @1marketvibe
Understanding the Hidden Risks Behind Record Market Highs
In recent days, stock futures have shown a decline, even as major indexes have reached record highs. This paradoxical situation raises important questions about the underlying risks that may be masked by these impressive market performances. To navigate these complexities, traders can benefit from understanding key MarketVibe metrics such as the Crash Warning Index (CWI) and the % Above 50-DMA. These tools offer insights into market breadth, volatility, and internal strength, helping traders make informed decisions without relying on sensationalism or guesswork.
The Importance of MarketVibe Metrics
Why Traders Should Care
MarketVibe metrics provide a structured approach to understanding market conditions beyond surface-level price movements. For instance, the Crash Warning Index (CWI) is a composite measure that evaluates risk by considering factors like market breadth, volatility, and defensive sector behavior. It helps traders identify potential corrections or downturns, allowing them to adjust their risk exposure accordingly.
Similarly, the % Above 50-DMA indicates the percentage of stocks trading above their 50-day moving average, offering a snapshot of market breadth and trend health. This metric can inform decisions about the strength of a market rally or the potential for a reversal.
How These Metrics Work
Crash Warning Index (CWI)
The CWI is constructed by aggregating several risk dimensions, including:
- Breadth: Measures the proportion of stocks advancing versus declining.
- Volatility: Assessed through metrics like the ATR%, which calculates average true range as a percentage of price.
- Defensive Behavior: Evaluates the performance of defensive sectors compared to the broader market.
A higher CWI suggests elevated risk, often preceding market corrections. For example, a CWI above 6 indicates a heightened likelihood of a downturn.
% Above 50-DMA
This metric calculates the percentage of stocks in a given universe (such as the S&P 500) that are trading above their 50-day moving average. A higher percentage suggests strong market breadth, while a lower percentage indicates potential weakness or oversold conditions.
Day-to-day movements in this metric are influenced by changes in individual stock prices relative to their moving averages. For instance, if a significant number of stocks fall below their 50-DMA, the overall percentage will decrease, signaling potential market weakness.
Interpreting Metric Levels
CWI Levels
- Below 3: Generally indicates low risk, with stable market conditions.
- 3 to 6: Suggests caution, as risk factors are increasing.
- Above 6: Signals high risk, with a greater chance of market corrections.
% Above 50-DMA
- Above 70%: Indicates strong market breadth and a healthy uptrend.
- 50% to 70%: Reflects moderate strength, with potential for continued gains.
- Below 50%: Suggests weak breadth, often preceding market pullbacks.
Common Combinations
- Strong Breadth + Low Volatility: Typically corresponds to stable, trending markets.
- Weak Breadth + Rising Volatility: Often precedes market corrections or increased risk environments.
- Defensive Sectors Leading: When combined with high CWI, it suggests a shift towards risk aversion.
Real-World Scenarios
Topping Environment
Imagine a scenario where the market indices are reaching new highs, but the % Above 50-DMA is declining. This suggests that fewer stocks are participating in the rally, indicating a potential topping environment. Traders might feel tempted to chase the highs, but a more informed approach would be to exercise caution and consider reducing exposure.
Strong Bull Leg
In a strong bull market, the % Above 50-DMA might surge to over 80% and remain elevated. This scenario reflects broad participation in the rally, providing confidence to add exposure, provided that individual setups align with the broader trend.
Volatility Spike
Suppose the ATR% jumps significantly, and the CWI accelerates past 6. This combination indicates a volatility spike and heightened risk, prompting traders to consider defensive strategies, such as tightening stops or reducing position sizes.
Incorporating Insights into a Trading Process
Practical Guidelines
- High CWI and Weak Breadth: Emphasize defensive strategies, reduce new risk, and consider hedging.
- Strong Breadth and Leadership: Be open to increasing exposure, but ensure setups align with broader trends.
- Use Market Dashboard: Leverage the Decision Edge dashboard to assess high-level market regimes and confirm with internal metrics.
Common Misuses and Misconceptions
Misuse Examples
Stand-Alone Entry Signal: Treating CWI or % Above 50-DMA as entry signals without context can lead to poor timing decisions. Instead, use them to guide risk posture.
Ignoring Context: Failing to consider sector rotation or broader market conditions can skew interpretations. Always integrate these metrics with a holistic market view.
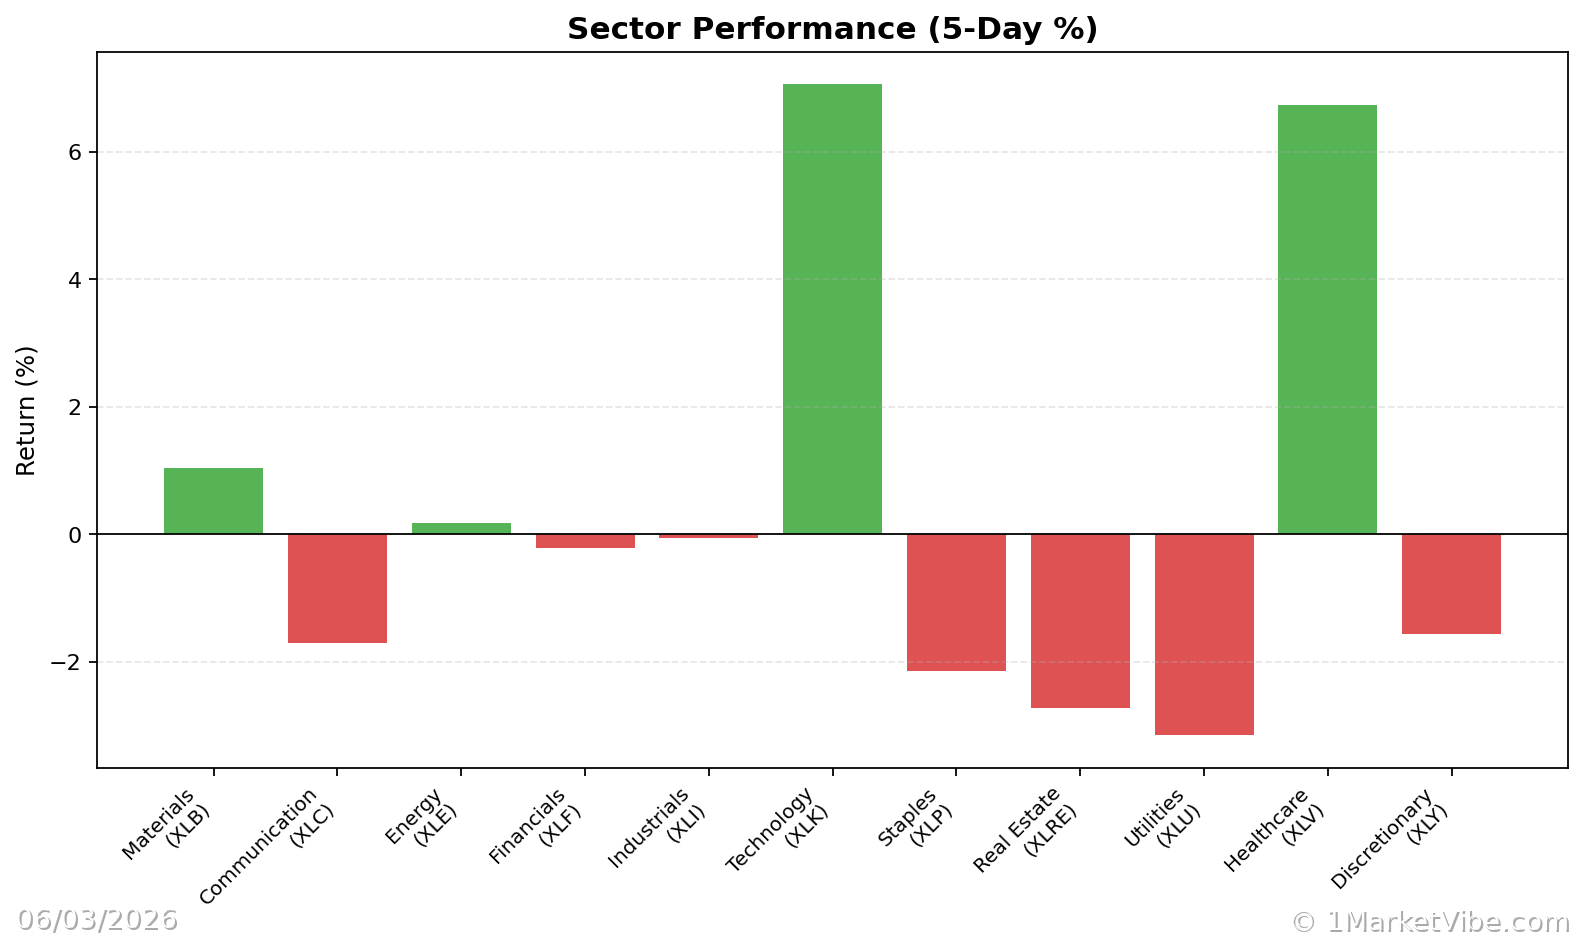
- Overreacting to One-Day Changes: Metrics can fluctuate daily; focus on trends and sustained levels rather than reacting to short-term moves.
By understanding and applying these insights, traders can better navigate the complexities of the market, especially during periods of record highs and underlying risks. To see these breadth and risk metrics in one place each day, you can use the Decision Edge dashboard at 1marketvibe.com.
Disclaimer: This article is for informational purposes only and does not constitute financial advice. Trading involves risk, and past performance is not indicative of future results.