

Bitcoin Falls Below $63,000 and Its Implications for Investors
- Authors

- Name
- MarketVibe Team
- @1marketvibe
Bitcoin Falls Below $63,000 and Its Implications for Investors
Bitcoin's recent dip below $63,000 marks a significant moment for investors, as it reflects broader market dynamics and potential shifts in sentiment. Understanding these movements through the lens of MarketVibe's metrics can help traders navigate the current landscape more effectively. In this article, we'll explore how metrics like the Crash Warning Index (CWI), % Above 50-DMA, and ATR% can provide insights into Bitcoin's price action and broader market conditions.
Understanding the Market Context
Bitcoin's fall below $63,000 is not just a number; it's a signal of underlying market forces at play. This drop comes after a period of heightened volatility and reflects broader concerns about valuation and market stability. As traders, it's crucial to understand the implications of such moves and how they fit into a structured decision-making process.
Why Traders Should Care
- Informed Decision-Making: Metrics like CWI and % Above 50-DMA help traders assess risk levels and market health, informing decisions on position sizing and risk exposure.
- Reducing Blind Spots: By understanding market breadth and volatility, traders can avoid overreacting to price movements and focus on the bigger picture.
- Structured Process: These metrics are not magic signals but tools to guide a disciplined approach to trading, emphasizing risk management and strategic planning.
How MarketVibe Metrics Work
Crash Warning Index (CWI)
The Crash Warning Index (CWI) is a composite metric that evaluates several risk dimensions, including market breadth, volatility, and defensive behavior. A higher CWI indicates elevated risk levels, suggesting that corrections are more likely. For example, a CWI above 6 for several days signals heightened caution.
% Above 50-DMA
The % Above 50-DMA measures the percentage of assets trading above their 50-day moving average, providing insight into market breadth and trend health. A low percentage indicates weak market breadth, often seen in oversold conditions, while a high percentage suggests strong market participation.
ATR% (Average True Range Percentage)
ATR% measures volatility relative to price, helping traders understand the current volatility regime. Low ATR% often corresponds to quiet, trending phases, while high ATR% indicates choppy or unstable conditions.
Interpreting Market Conditions
Current Market Regimes
- Weak Breadth + Rising Volatility: Bitcoin's drop below $63,000, coupled with high ATR%, suggests a volatile environment with weak market breadth. This combination often precedes further downside or consolidation.
- Defensive Behavior: With the CWI elevated, traders should be cautious, emphasizing defensive strategies and reducing new risk exposure.
Example Scenarios
Topping Environment: Imagine a scenario where Bitcoin grinds higher, but the % Above 50-DMA declines, indicating deteriorating breadth. Traders might feel tempted to chase the rally, but a more informed view would prioritize caution and risk management.
Volatility Spike: In a situation where ATR% jumps significantly, indicating increased volatility, traders might panic and exit positions prematurely. However, understanding that high ATR% often leads to choppy conditions can help maintain a disciplined approach.
Strong Bull Leg: Conversely, if % Above 50-DMA surges and remains elevated, it signals a strong bull leg. Traders can be more open to adding exposure, provided their setups align with broader market conditions.
Incorporating Insights into a Trading Process
Practical Guidelines
- Emphasize Defense: When breadth is weak and CWI is high, focus on defensive strategies and reduce new risk. This approach helps preserve capital during uncertain times.
- Broaden Exposure: If breadth and leadership improve, consider increasing exposure, but only if your setups are present. Use the Market Dashboard to confirm the broader regime.
- Monitor Volatility: Use ATR% to gauge the volatility regime and adjust your trading style accordingly. High volatility may require tighter risk controls and smaller position sizes.
Common Misuses and Misconceptions
- Stand-Alone Signals: Avoid treating any metric as a stand-alone entry signal. Metrics should guide your risk posture, not dictate precise timing.
- Ignoring Context: Always consider the broader market context, including sector rotation and time frame. Metrics are most effective when used in conjunction with other analysis.
- Overreacting to Daily Changes: Resist the urge to overreact to one-day changes in metrics. Focus on trends and sustained shifts to make informed decisions.
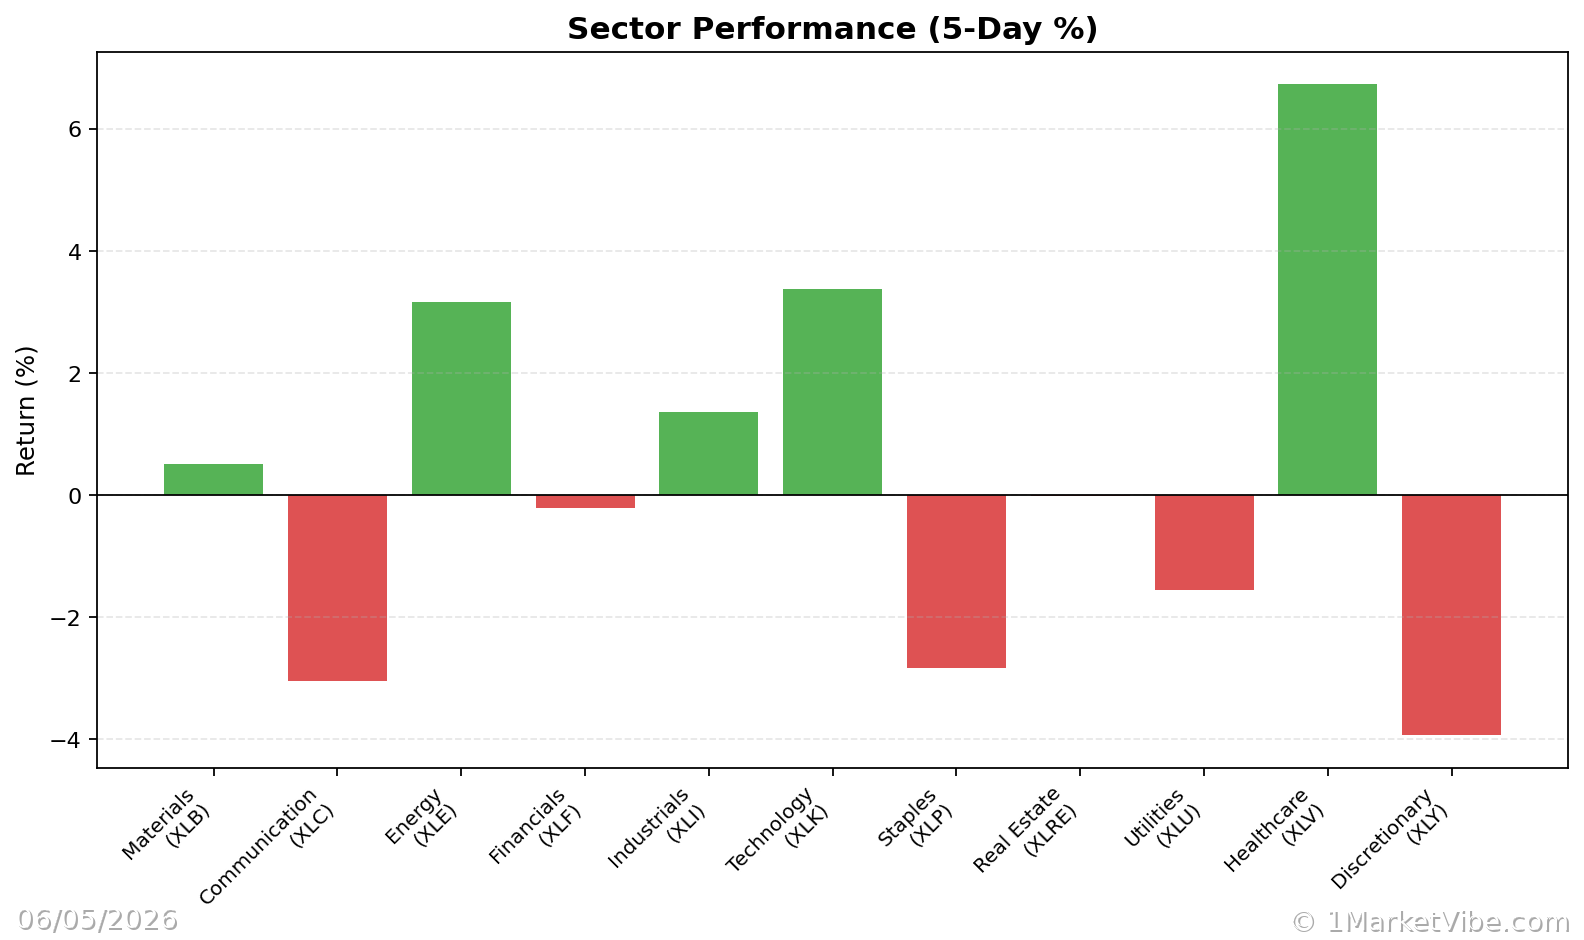
To see these breadth and risk metrics in one place each day, you can use the Decision Edge dashboard at 1marketvibe.com.
Disclaimer: This article is for informational purposes only and does not constitute financial advice. Please consult a financial advisor before making any investment decisions.