
Energy Challenges Intensify as CW Index Reaches 7.3
In today's complex market environment, understanding the underlying risk conditions is crucial for traders and investors. One of the key metrics that MarketVibe offers to help decode these conditions is the Crash Warning Index (CWI). Recently, the CWI has reached a level of 7.3, signaling heightened risk in the market, particularly in the energy sector. This article will explore what the CWI is, how it works, and why its current reading is significant for traders.
What is the Crash Warning Index (CWI)?
The Crash Warning Index (CWI) is a composite metric designed to provide an early warning of potential market corrections or crashes. It aggregates several dimensions of market risk, including breadth, volatility, and defensive behavior. By synthesizing these elements, the CWI offers a comprehensive view of market stability and potential risk.
Why Traders Should Care
Understanding the CWI can inform critical trading decisions, such as adjusting risk exposure or timing defensive strategies. It helps reduce blind spots by highlighting underlying market stress that might not be visible through price action alone. Rather than serving as a magic signal, the CWI should be integrated into a structured decision-making process to guide risk management and strategy adjustments.
How the CWI Works
Mechanics & Data
The CWI is constructed by analyzing several key market indicators:
- Breadth: Measures the number of stocks participating in a market move. For instance, the percentage of stocks above their 50-day moving average (% Above 50-DMA) provides insight into the overall health of market trends.
- Volatility: Assessed using metrics like ATR% (Average True Range as a percentage of price), which indicates the market's volatility regime.
- Defensive Behavior: Observes the performance of defensive sectors relative to the broader market.
These components are combined to produce a single index value. Daily movements in the CWI are influenced by changes in these underlying indicators, such as a sudden increase in volatility or a deterioration in market breadth.
Interpretation of CWI Levels
Understanding CWI Ranges
- CWI below 3: Indicates a stable market environment with low risk of correction.
- CWI between 3 and 6: Suggests moderate risk, where caution is advised.
- CWI above 6: Signals elevated risk, with a higher likelihood of market corrections.
When the CWI is above 6 for several days, as it is currently at 7.3, it suggests that risk is significantly elevated. This level often precedes market corrections, making it a critical signal for traders to consider.
Common Combinations
- Weak Breadth + Rising Volatility: Often seen in topping environments where indices may still rise, but fewer stocks participate.
- Defensive Sectors Leading: Indicates a shift towards risk aversion, often aligning with higher CWI readings.
Real-World Scenarios
Scenario 1: Topping Environment
Imagine a scenario where major indices continue to climb, but the % Above 50-DMA declines, indicating fewer stocks are driving the index higher. During this period, the CWI might rise above 6, warning of potential instability. Traders might feel tempted to chase the rally, but a more informed approach would emphasize caution and risk management.
Scenario 2: Volatility Spike
Consider a sudden geopolitical event, such as escalating tensions in the Middle East, leading to a spike in oil prices and market volatility. The ATR% would likely increase, contributing to a higher CWI. In this case, traders might initially react by reducing exposure, but understanding the CWI could guide them to consider hedging strategies or defensive plays.
Scenario 3: Defensive Leadership
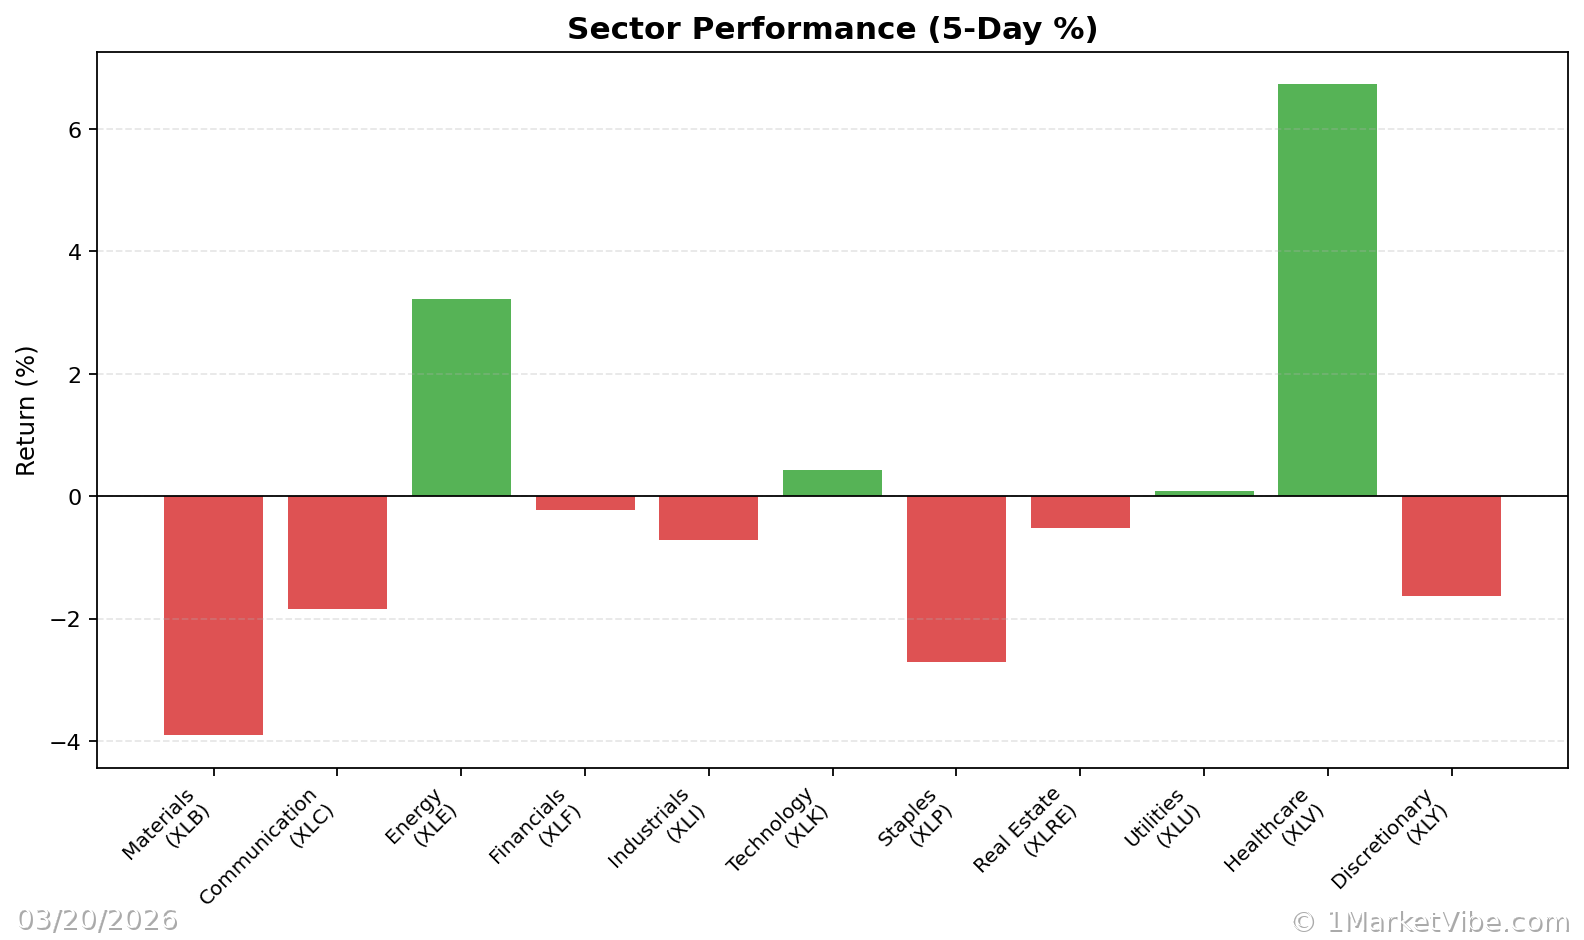
In a market where defensive sectors like utilities and consumer staples begin to outperform, the CWI may rise, reflecting increased risk aversion. Traders might be tempted to rotate into these sectors, but the CWI suggests maintaining a balanced approach, with an eye on potential corrections.
How to Use This Insight in a Process
Practical Guidelines
- Emphasize Defense: When the CWI is high, prioritize capital preservation and reduce new risk exposure.
- Monitor Breadth and Leadership: Use the Market Dashboard to assess whether market participation is broadening or narrowing.
- Adjust Exposure: Be more open to adding exposure when breadth and leadership improve, provided your setups align with your strategy.
These guidelines help traders maintain a disciplined approach, using the CWI to inform their risk posture rather than dictate precise timing.
Common Misuses & Misconceptions
Misuse 1: Stand-Alone Signal
Some traders might treat the CWI as a stand-alone entry or exit signal. A healthier approach is to use it as part of a broader risk assessment framework.
Misuse 2: Ignoring Context
Ignoring sector rotation or time frame can lead to misinterpretation. Always consider the broader market context and how different sectors are performing.
Misuse 3: Overreacting to One-Day Changes
The CWI is most effective when viewed over several days. Reacting to single-day changes can lead to whipsaw decisions. Instead, focus on sustained trends in the index.
To see these breadth and risk metrics in one place each day, you can use the Decision Edge dashboard at 1marketvibe.com.
Disclaimer: This article is for informational purposes only and does not constitute financial advice. Please consult with a financial advisor before making any investment decisions.