

CW Index Signals Increased Risks in Anthropic's $6 Billion AI Acquisition
- Authors

- Name
- MarketVibe Team
- @1marketvibe
CW Index Signals Increased Risks in Anthropic's $6 Billion AI Acquisition
1. Orientation – What Are We Explaining?
In this article, we will explore the Crash Warning Index (CWI) and its implications for Anthropic's potential $6 billion acquisition of Decart AI. The CWI is a composite metric that aggregates several dimensions of market risk, including breadth, volatility, and defensive behavior. Traders should pay attention to the CWI because it provides a structured way to assess market risk levels, helping to inform decisions about risk exposure and portfolio adjustments. By understanding the CWI, traders can reduce blind spots related to sudden market shifts and better integrate risk management into their trading process.
2. How It Works – Mechanics & Data
The Crash Warning Index (CWI) is constructed by combining various market indicators that reflect underlying risk conditions. These include:
- Breadth metrics: Such as the percentage of stocks above their 50-day moving average, which indicates the overall health of market trends.
- Volatility measures: Like the Average True Range (ATR%) that captures market volatility relative to price.
- Defensive behavior: Observed through sector rotation into traditionally safer sectors like utilities and consumer staples.
The CWI is sensitive to changes in these components. For instance, a decline in the percentage of stocks above their 50-DMA, combined with rising volatility, can push the CWI higher, signaling increased market risk. Day-to-day movements in the CWI are driven by shifts in these underlying metrics, reflecting changes in market sentiment and risk appetite.
3. Interpretation – What Different Levels Tend to Mean
The CWI provides a range of readings that help traders gauge market risk:
- Below 3: Generally indicates a stable market environment with low risk of correction.
- Between 3 and 6: Suggests a moderate increase in risk, warranting closer monitoring of market conditions.
- Above 6: Signals elevated risk levels, where market corrections become more likely.
Common combinations of market conditions can provide further insights. For example:
- Strong breadth + low volatility: Typically indicates a healthy, trending market.
- Weak breadth + rising volatility: Often precedes market corrections or increased risk.
- Defensive sectors leading: Suggests a shift towards risk aversion, often seen when the CWI is high.
4. Real-World Scenarios – How This Shows Up in Markets
Scenario 1: Topping Environment
Imagine a scenario where major indices continue to rise, but the percentage of stocks above their 50-DMA declines. This divergence can lead to a higher CWI, indicating that while the index appears strong, underlying breadth is weakening. Traders might feel tempted to buy into the rally, but a more informed view would suggest caution and a potential for a market top.
Scenario 2: New Bull Leg
In a strong new bull market, the percentage of stocks above their 50-DMA might surge and remain elevated, while volatility remains low. The CWI would likely be low, supporting a more aggressive risk-taking posture. Traders might feel confident in adding exposure, aligning with the broader market trend.
Scenario 3: Volatility Spike
Consider a sudden increase in market volatility, where the ATR% jumps significantly. This could coincide with a rising CWI, signaling heightened risk. Traders might be tempted to panic-sell, but understanding the CWI could encourage a more measured response, such as adjusting position sizes or employing hedging strategies.
5. How to Use This Insight in a Process
To effectively incorporate the CWI into your trading process:
- Emphasize Defense: When the CWI is high and breadth is weak, prioritize defensive strategies and reduce new risk exposure.
- Broaden Exposure: When breadth and leadership improve, consider increasing exposure, provided your setups align with market conditions.
- Use Market Dashboard: Leverage MarketVibe's Decision Edge dashboard to get a high-level view of market regimes, then confirm with internal metrics like the CWI.
6. Common Misuses & Misconceptions
Traders often misuse the CWI by:
- Treating it as a Stand-Alone Signal: The CWI should not be used in isolation for entry or exit decisions. Instead, integrate it with other market indicators.
- Ignoring Context: Failing to consider sector rotation or broader market trends can lead to misinterpretation of the CWI.
- Overreacting to One-Day Changes: The CWI is more meaningful over a series of days rather than reacting to daily fluctuations.
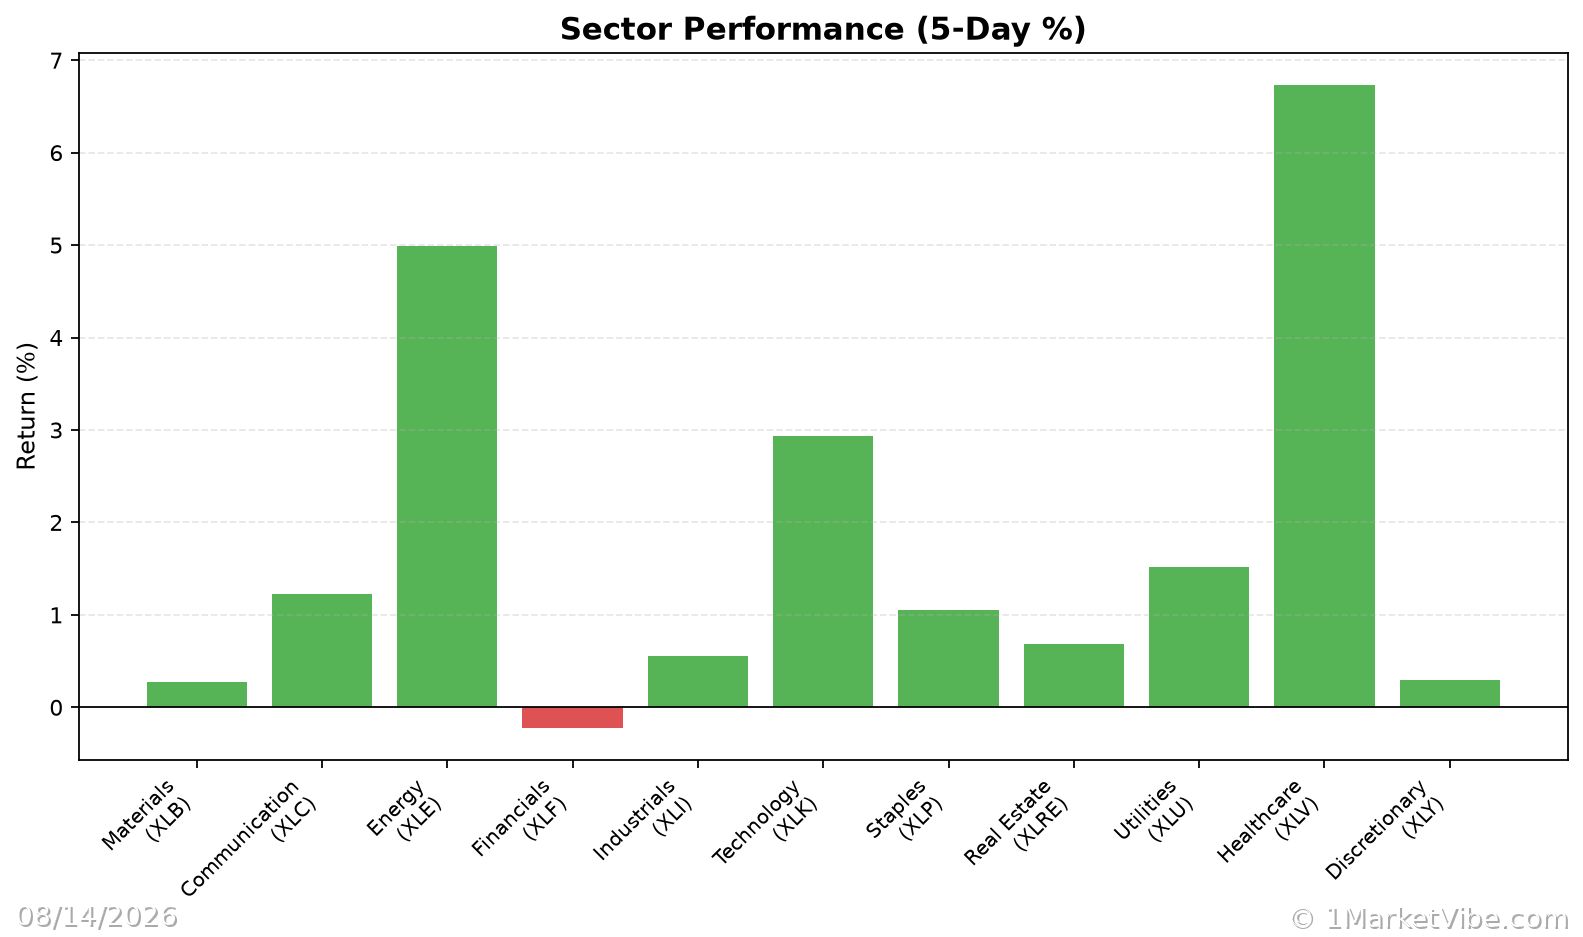
A healthier approach involves using the CWI as part of a comprehensive risk management strategy, considering broader market context and aligning with your trading plan.
To see these breadth and risk metrics in one place each day, you can use the Decision Edge dashboard at 1marketvibe.com.
DISCLAIMER: This article is for informational purposes only and does not constitute financial advice. Please consult with a financial advisor before making any investment decisions.