

CoreWeave's Stock Surge: Analyzing the Impact of Q2 Earnings
- Authors

- Name
- MarketVibe Team
- @1marketvibe
CoreWeave's Stock Surge: Analyzing the Impact of Q2 Earnings
In the world of trading, understanding the underlying factors that drive stock movements is crucial. CoreWeave's recent Q2 earnings report provides a valuable case study in how earnings announcements can impact stock prices. This article will explore the mechanics behind CoreWeave's stock surge, using MarketVibe's metrics to provide a deeper understanding of market reactions.
Q2 Earnings Overview
CoreWeave, an AI cloud provider, reported its Q2 earnings with a notable reduction in losses per share, coming in at -$1.14 compared to the expected -$1.41. Revenue met expectations at $2.5 billion, doubling year over year. This performance marked an important inflection point for the company, as it began to leverage its scale into expanding operating leverage.
Market Reaction
Following the earnings announcement, CoreWeave's stock climbed 8% post-market, with premarket action seeing a surge as high as 20%. This reaction underscores the market's positive sentiment towards the company's ability to narrow losses and meet revenue expectations. Investors were particularly encouraged by CoreWeave's adjusted operating income of $128 million, which exceeded the consensus estimate of $66 million.
CoreWeave's Position in the AI Cloud Market
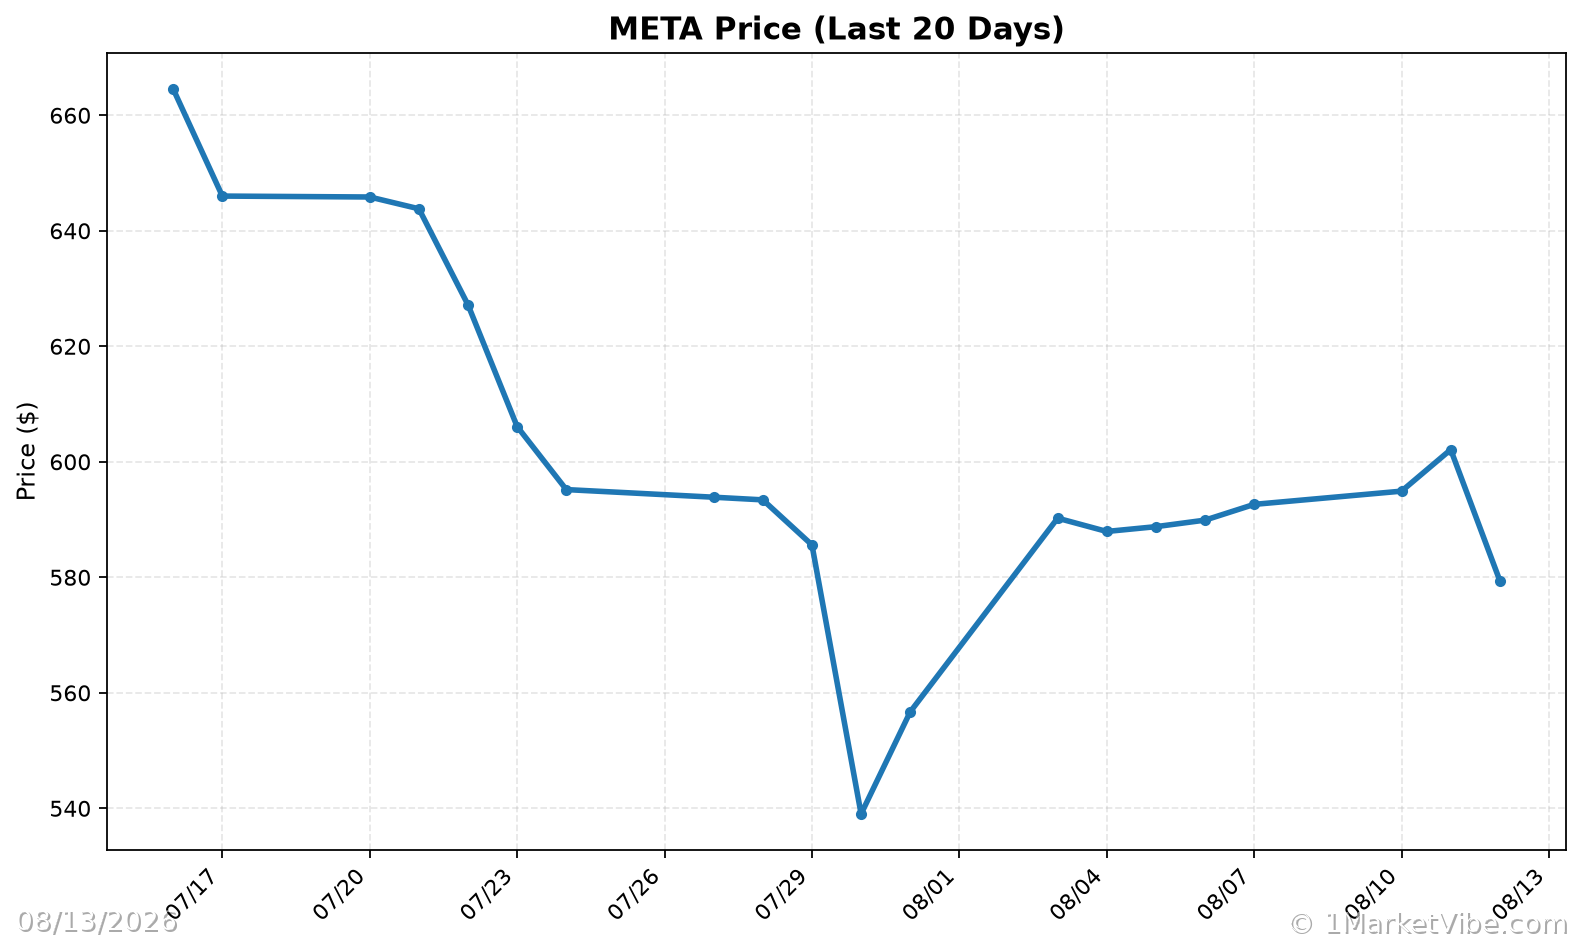
CoreWeave operates in a highly competitive AI cloud market, facing competition from giants like SpaceX and potential entrants like Meta. The company is investing heavily in building data centers to host AI chips, a move that positions it well to capitalize on the growing demand for AI computing power. However, this also presents potential risks, as increased competition could pressure CoreWeave's market share.
Financial Health Indicators
To gauge CoreWeave's financial health, traders should monitor key metrics such as revenue growth, operating income, and capital expenditures. The company's revenue backlog of $104 billion, excluding Q3 commitments of $25 billion, indicates strong future demand. However, the significant investment in data centers could strain financial resources if not managed carefully.
Future Outlook
The AI cloud market is poised for continued growth, driven by increasing enterprise adoption and the need for advanced computing capabilities. CoreWeave's strategic investments position it well to benefit from these trends, but traders should remain vigilant about potential risks, including competition and capital expenditure pressures.
Practical Process Guidance
For traders, understanding how to incorporate these insights into a structured process is key. Here are some practical guidelines:
- Monitor Position Sizing: Use MarketVibe's Crash Warning Index (CWI) to assess overall market risk. If CWI levels are high, consider reducing exposure to high-risk sectors like AI cloud.
- Adjust Risk Exposure: When breadth indicators such as % Above 50-DMA show strong market participation, it may be safer to increase exposure, provided setups align with your strategy.
- Consider Hedging Strategies: If volatility metrics like ATR% indicate rising market instability, hedging positions could help mitigate potential losses.
Common Misuses & Misconceptions
Traders often fall into traps when interpreting market metrics. Here are some common misuses and healthier alternatives:
Treating Metrics as Stand-Alone Signals: Metrics like CWI or % Above 50-DMA should not be used in isolation. Always consider the broader market context and sector-specific factors.
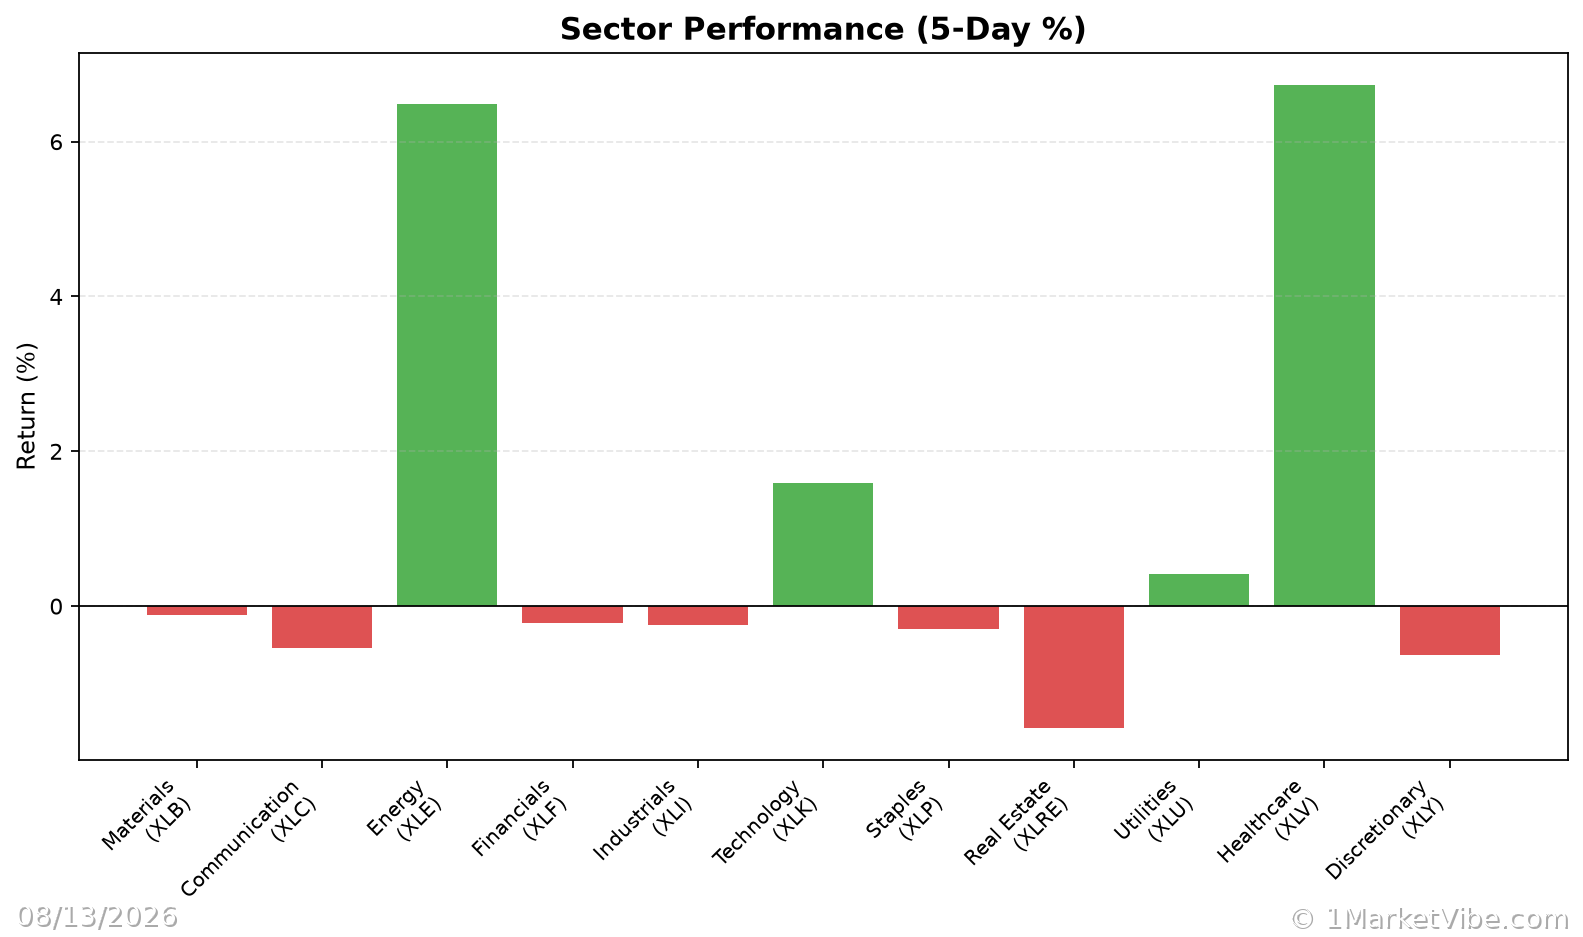
Ignoring Sector Rotation: Market dynamics can shift rapidly. Pay attention to sector scores and leadership changes to stay aligned with market trends.
- Overreacting to One-Day Changes: Short-term fluctuations can be misleading. Focus on sustained trends and patterns rather than reacting to daily noise.
Conclusion
CoreWeave's Q2 earnings report highlights the importance of understanding earnings announcements and their impact on stock prices. By leveraging MarketVibe's metrics, traders can gain a deeper insight into market reactions and make more informed decisions. To see these breadth and risk metrics in one place each day, you can use the Decision Edge dashboard at 1marketvibe.com.
DISCLAIMER: This article is for informational purposes only and does not constitute financial advice. Please consult with a financial advisor before making any investment decisions.