BP Reports $5.7 Billion Profit Surge and Its Impact on Big Oil and Investors
- Authors

- Name
- MarketVibe Team
- @1marketvibe
BP's $5.7 Billion Profit Surge: Implications for Big Oil and Investors
In the wake of BP's recent announcement of a substantial profit surge, understanding the broader implications for the oil industry and investors becomes crucial. This article will explore how BP's financial performance fits into the current market landscape, the potential impact on investors, and how MarketVibe's metrics can provide deeper insights into these developments.
BP's Financial Performance: A Closer Look
BP reported a second-quarter profit of $5.7 billion, significantly exceeding analyst expectations of $5 billion. This marks a notable increase from the $2.35 billion profit recorded in the same period last year. The surge in profits is largely attributed to the rise in oil and gas prices amid geopolitical tensions, particularly the conflict between the U.S. and Iran, which has disrupted oil supply routes.
Market Context and Broader Economic Conditions
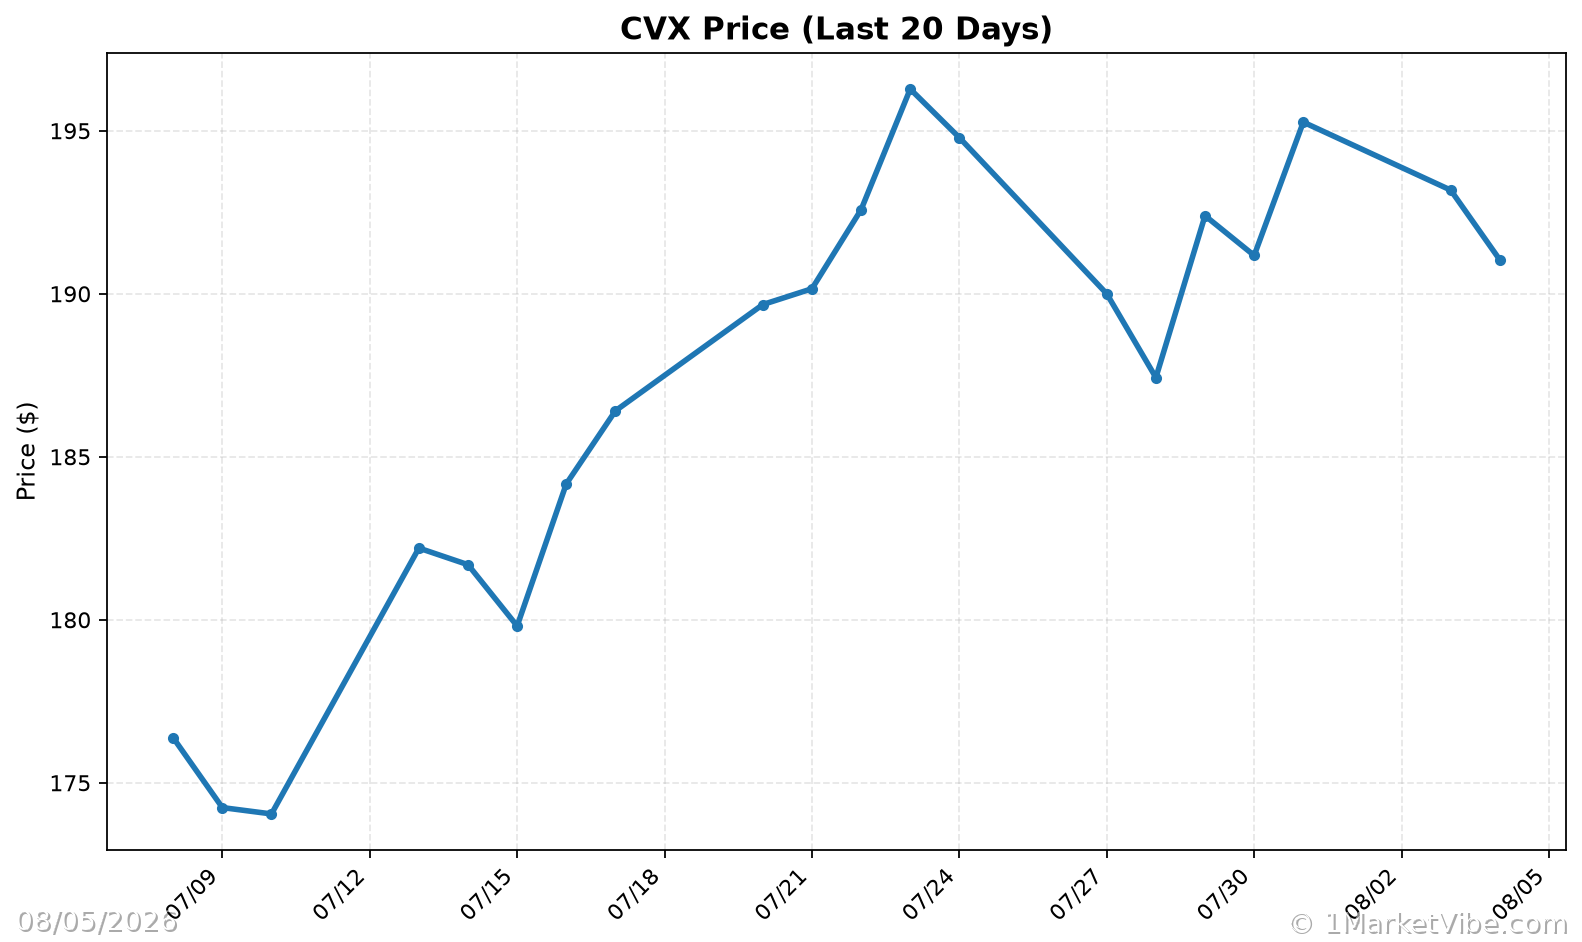
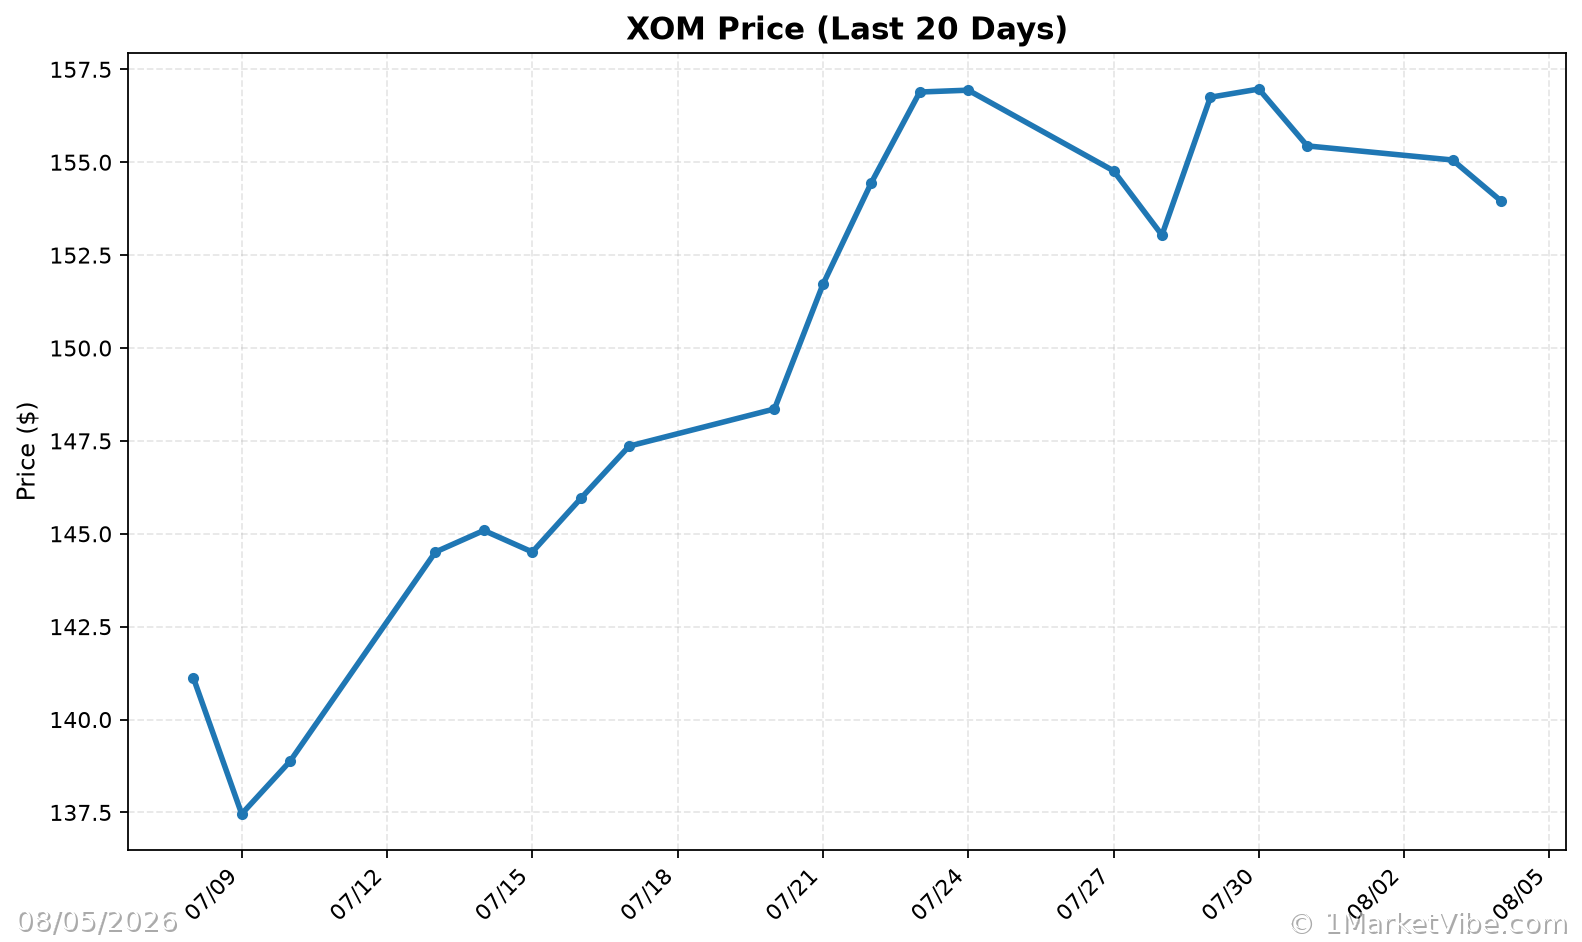
The geopolitical situation has led to increased volatility in oil prices, impacting not only BP but also other major oil companies like Exxon Mobil and Chevron, which have reported similarly impressive profit increases. This environment creates a complex backdrop for investors, where understanding market dynamics becomes essential.
Using MarketVibe Metrics to Navigate the Oil Market
To navigate these market conditions effectively, investors can leverage MarketVibe's suite of metrics. Here's how some of these tools can provide clarity:
Crash Warning Index (CWI)
The CWI is a composite indicator that assesses market risk by considering factors like breadth, volatility, and defensive behavior. In the context of rising oil prices, a high CWI could signal elevated market risk, suggesting that investors should be cautious about taking on new positions in the oil sector.
% Above 50-DMA
This metric measures the percentage of stocks trading above their 50-day moving average, providing insight into market breadth and trend health. A high percentage indicates strong market breadth, which could be supportive of continued strength in oil stocks if they are leading the market.
ATR% (Average True Range Percentage)
ATR% is a volatility measure that compares the current price range to historical averages. In periods of high volatility, such as those driven by geopolitical tensions, ATR% can help investors gauge the stability of price movements in the oil sector.
Interpreting Market Conditions with MarketVibe
High CWI and Rising Oil Prices
- Scenario: If the CWI is above 6, indicating elevated risk, and oil prices are rising, it suggests a cautious approach. Investors might consider reducing exposure to high-risk oil stocks or implementing hedging strategies.
- Investor Response: Avoid aggressive risk-taking and focus on defensive sectors or assets.
Strong Breadth with High % Above 50-DMA
- Scenario: A high % Above 50-DMA indicates strong market breadth, which, when combined with rising oil prices, could suggest a robust market environment.
- Investor Response: Consider increasing exposure to leading oil stocks, provided other risk metrics like CWI remain in a manageable range.
Volatility Spike Indicated by High ATR%
- Scenario: A sudden increase in ATR% suggests heightened volatility, often seen during geopolitical crises.
- Investor Response: Be prepared for rapid price movements and adjust position sizes accordingly to manage risk.
Practical Guidelines for Investors
- Monitor MarketVibe's Decision Edge Dashboard: Use it as a high-level overview of market conditions, then dive deeper into specific metrics like CWI and % Above 50-DMA for confirmation.
- Adjust Risk Exposure: In high-risk environments, consider reducing exposure to volatile sectors like oil, or use options strategies to hedge against potential downturns.
- Focus on Breadth and Leadership: When market breadth is strong and leadership is clear, it may be a good time to selectively add exposure to strong-performing sectors.
Common Misuses and Misconceptions
Treating Metrics as Stand-Alone Signals: Avoid using any single metric as a definitive buy or sell signal. Always consider the broader market context.
Ignoring Sector Rotation: Be aware of how leadership shifts between sectors, especially in volatile environments. Oil may lead during geopolitical tensions, but this can change rapidly.
Overreacting to Short-Term Changes: Metrics like ATR% can fluctuate daily. Focus on sustained trends rather than reacting to one-day spikes.
By integrating these insights into a structured investment process, traders can better navigate the complexities of the oil market and make informed decisions. To see these breadth and risk metrics in one place each day, you can use the Decision Edge dashboard at 1marketvibe.com.
Disclaimer: This article is for informational purposes only and does not constitute financial advice. Always conduct your own research or consult a financial advisor before making investment decisions.
Charts