

OpenAI's $850 Billion ChatGPT Overhaul: Key Insights for Investors
- Authors

- Name
- MarketVibe Team
- @1marketvibe
OpenAI's $850 Billion ChatGPT Overhaul: Key Insights for Investors
In the ever-evolving landscape of artificial intelligence, OpenAI's ambitious plans to overhaul ChatGPT mark a significant milestone. With a staggering valuation of $850 billion, this development is not just a technological leap but a pivotal moment for investors keen on understanding the implications for the AI market. This article will delve into the strategic goals behind OpenAI's overhaul, the potential market dynamics, and how investors can navigate these changes using MarketVibe's metrics and frameworks.
Market Context and Strategic Goals
OpenAI's decision to revamp ChatGPT is driven by a strategic focus on higher-margin products. This move aims to solidify its position in the AI market and potentially pave the way for an initial public offering (IPO). For investors, understanding the valuation and strategic direction of OpenAI is crucial, as it signals shifts in the AI landscape that could impact investment strategies.
Implications for the AI Market Landscape
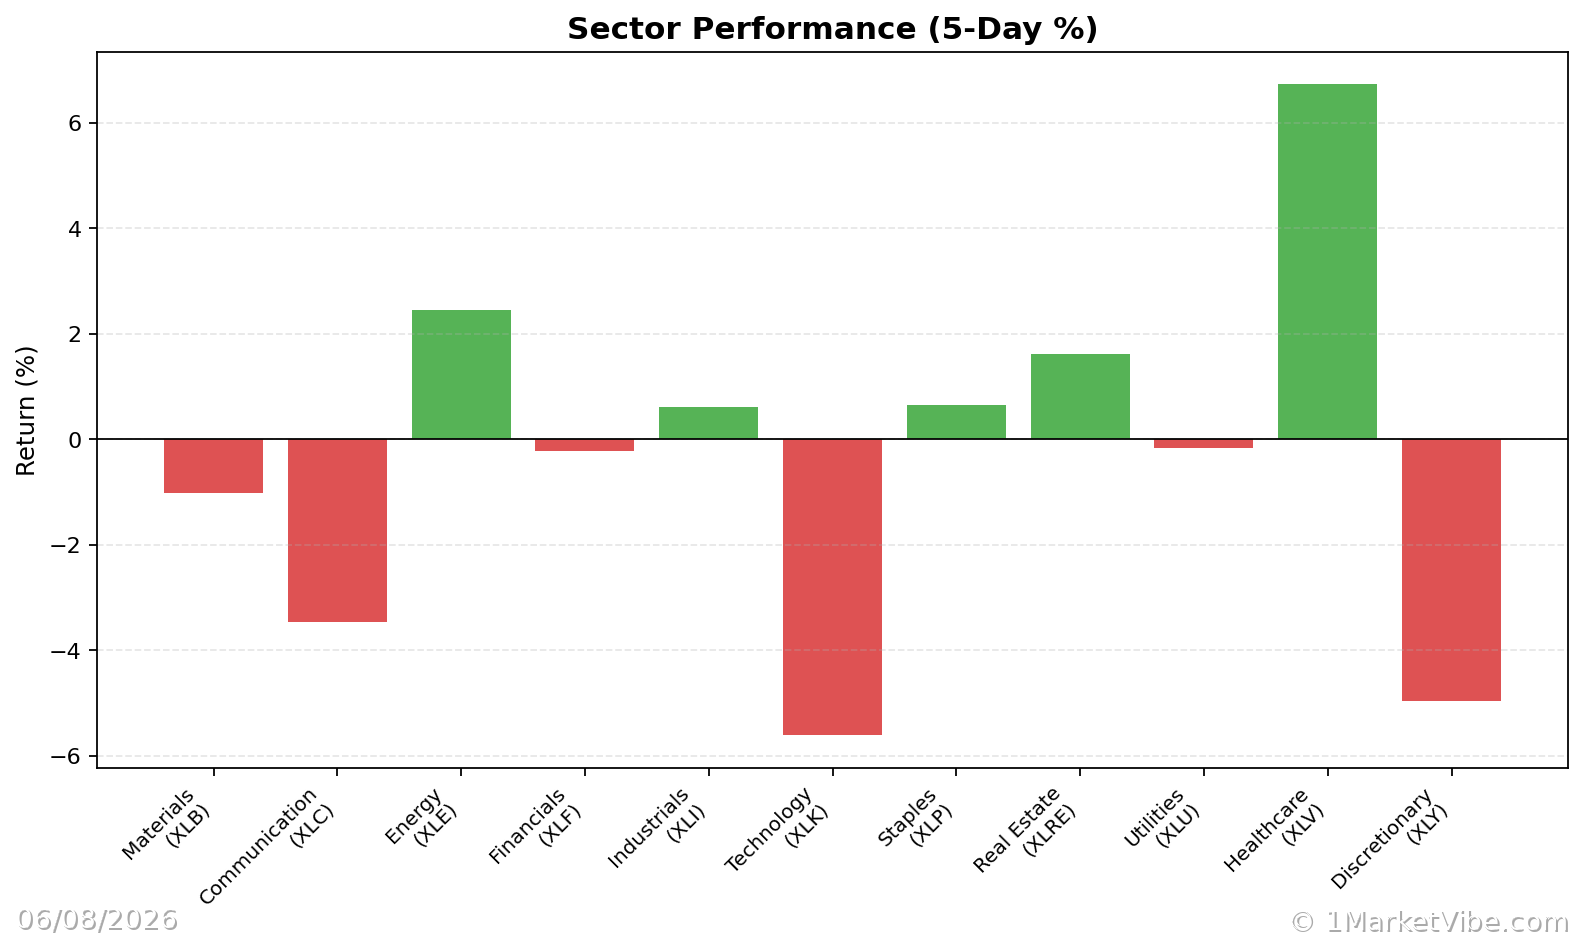
The overhaul positions OpenAI as a formidable player against competitors, potentially reshaping market dynamics. As AI continues to permeate various sectors, the ripple effects of such a significant development could influence market trends, sector performance, and investment opportunities.
How MarketVibe Metrics Can Guide Investors
To navigate these changes, investors can leverage MarketVibe's suite of metrics, which provide a comprehensive view of market conditions and risk levels.
Crash Warning Index (CWI)
CWI is a composite metric that assesses market risk by analyzing breadth, volatility, and defensive behavior. When CWI is elevated, it indicates heightened risk, suggesting that investors should adopt a more defensive posture. For instance, if OpenAI's overhaul leads to increased volatility in the tech sector, a rising CWI would signal caution.
% Above 50-DMA
The % Above 50-DMA metric measures the percentage of stocks trading above their 50-day moving average, offering insights into market breadth and trend health. A high percentage indicates strong market breadth, while a low percentage suggests weakness. In the context of OpenAI's overhaul, monitoring this metric can help investors gauge the broader market's response to AI sector developments.
ATR% and Volatility
ATR% measures volatility relative to price, providing insights into market stability. Low ATR% values often correspond to stable, trending markets, while high values indicate choppy conditions. As OpenAI's strategic moves unfold, changes in ATR% can help investors assess the volatility regime and adjust their strategies accordingly.
Real-World Scenarios
To illustrate how these metrics can inform investment decisions, consider the following scenarios:
Scenario 1: A Topping Environment
Imagine a scenario where the broader market indices are grinding higher, but the % Above 50-DMA begins to decline. This divergence suggests weakening breadth, a potential precursor to a market top. Investors might feel tempted to chase the rally, but a more informed approach would be to reduce exposure and prepare for potential corrections, especially if CWI is also rising.
Scenario 2: A Strong Bull Leg
In contrast, suppose the % Above 50-DMA surges and remains elevated, indicating robust market breadth. This scenario could signal the start of a new bull leg, particularly if ATR% remains low, suggesting a stable trend. Investors could consider increasing exposure, provided their setups align with their risk management criteria.
Scenario 3: Volatility Spike
If OpenAI's overhaul leads to a sudden spike in volatility, reflected by a sharp increase in ATR%, investors might be tempted to panic. However, by monitoring CWI and other breadth indicators, they can better assess whether the volatility is a temporary reaction or indicative of deeper market instability.
Incorporating Insights into an Investment Process
To effectively use these insights, investors should integrate MarketVibe's metrics into their decision-making process:
- Emphasize Defense: When breadth is weak and CWI is high, prioritize defensive strategies and reduce new risk exposure.
- Broaden Exposure: As breadth and leadership expand, consider adding exposure, but only if setups meet your criteria.
- Monitor Regime Labels: Use the Market Dashboard to identify high-level market regimes, then confirm with internal metrics.
Common Misuses and Misconceptions
While MarketVibe's metrics offer valuable insights, they are not infallible. Common misuses include:
- Standalone Signals: Avoid treating any metric as a standalone entry signal. Instead, use them as part of a broader analysis.
- Ignoring Context: Consider sector rotation and time frames when interpreting metrics.
- Overreacting to Daily Changes: Focus on trends and sustained movements rather than reacting to one-day fluctuations.
By understanding these pitfalls, investors can make more informed decisions and avoid common traps.
To see these breadth and risk metrics in one place each day, you can use the Decision Edge dashboard at 1marketvibe.com.
Disclaimer: This article is for informational purposes only and does not constitute financial advice. Please consult a financial advisor before making investment decisions.