
US-Iran Tensions and Their Impact on Markets
Introduction
The ongoing tensions between the United States and Iran have once again captured global attention, as geopolitical events often do. These tensions can have significant implications for market stability, influencing everything from oil prices to stock market volatility. Understanding how these geopolitical dynamics interact with market forces is crucial for traders and investors looking to navigate uncertain waters.
Current Market Reactions
Recent developments have seen fluctuations in U.S. futures and stock markets, largely driven by news of Iran's ceasefire violations. This has led to a rise in oil prices, as markets react to the potential for disrupted supply lines. Such movements underscore the importance of monitoring geopolitical events as part of a comprehensive market analysis process.
Geopolitical Implications
US-Iran relations are a key factor in global stability. Tensions between these nations can lead to ripple effects across other markets and economies, influencing everything from currency valuations to commodity prices. For traders, understanding these dynamics can help in anticipating market shifts and adjusting strategies accordingly.
Market Sentiment Analysis
Market sentiment is a critical component of understanding how geopolitical events impact markets. By analyzing sentiment readings, traders can gain insights into the collective mood of the market, which can often precede significant price movements. Comparing current sentiment with past responses to similar geopolitical tensions can provide valuable context.
CW Index Insights
The Crash Warning Index (CWI) is a composite metric that incorporates several risk dimensions, including breadth, volatility, and defensive behavior. It serves as an early warning system for potential market corrections. Currently, the CWI stands at 5.7, indicating elevated risk levels. This suggests that traders should be cautious and consider defensive strategies.
How the CWI Works
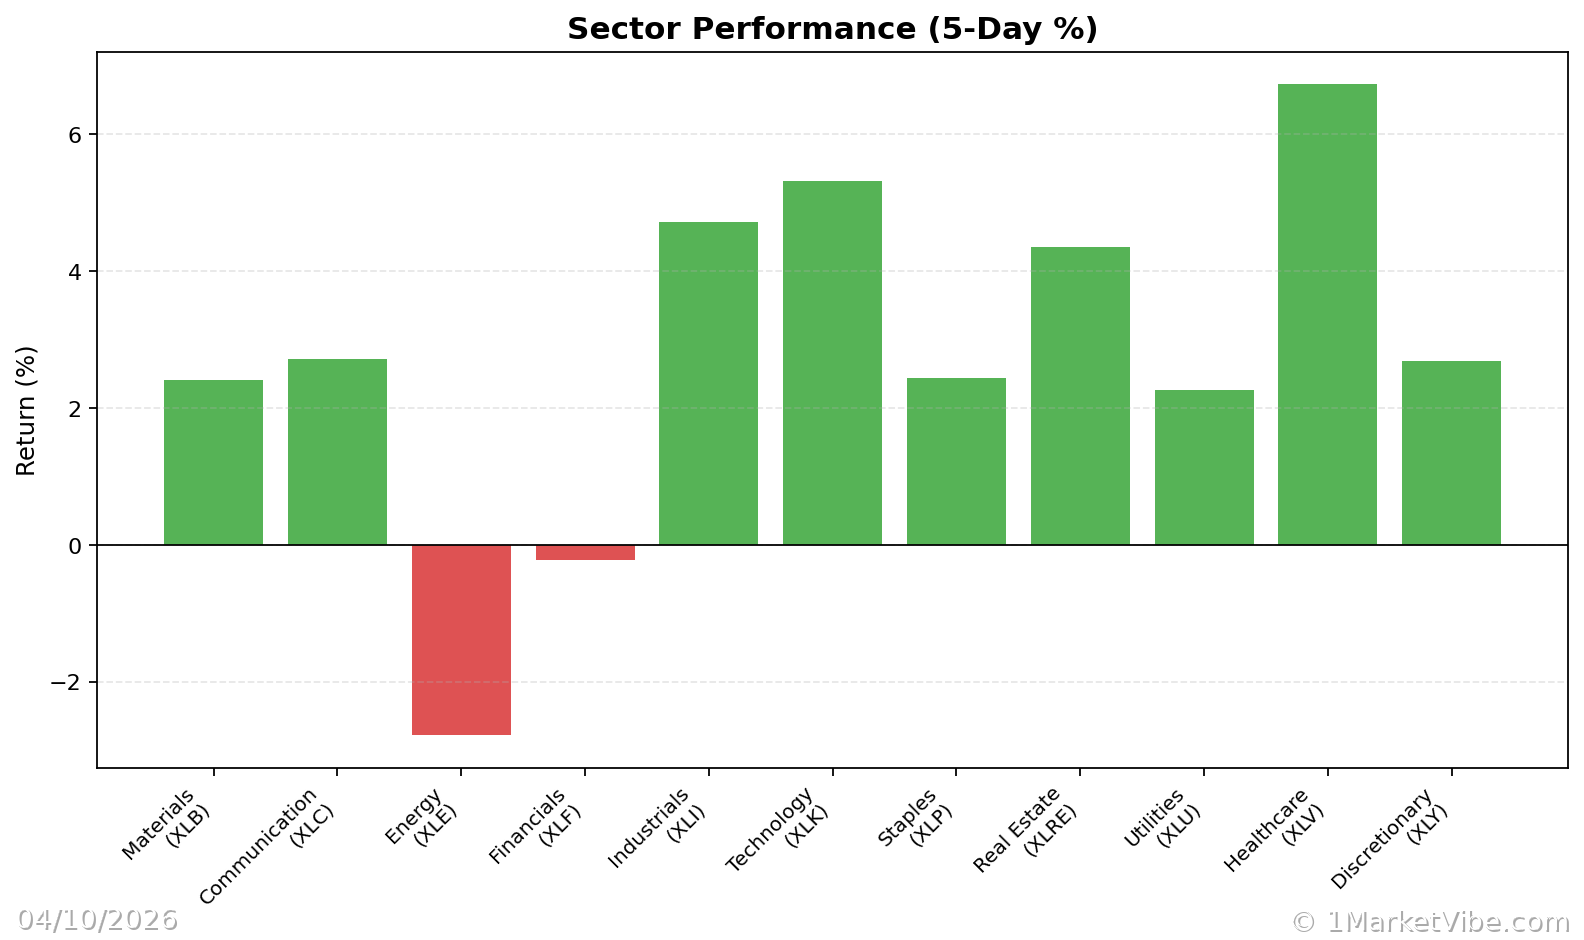
The CWI is constructed by analyzing various market indicators, such as breadth (the percentage of stocks above their 50-day moving averages), volatility (measured by ATR%), and sector performance. These components are combined to provide a holistic view of market risk. Day-to-day movements in the CWI are influenced by changes in these underlying indicators.
Historical Context
Looking at past US-Iran conflicts, we see a pattern of market volatility and shifts in investor sentiment. For example, previous crises have led to spikes in oil prices and increased market volatility. By studying these historical events, traders can better prepare for potential market reactions to current tensions.
Risk Awareness
Geopolitical tensions introduce a level of unpredictability to market reactions. During such times, it is crucial for investors to adopt cautious investment strategies. This might include reducing exposure to high-risk assets, diversifying portfolios, and considering hedging strategies to mitigate potential losses.
Real-World Scenarios
Scenario 1: Topping Environment
In a topping environment, the market index might continue to grind higher even as breadth deteriorates. For example, if the % Above 50-DMA falls below 40%, it indicates that fewer stocks are participating in the rally, suggesting underlying weakness. Traders might be tempted to chase the rally, but a more informed approach would be to monitor the CWI for signs of elevated risk and adjust exposure accordingly.
Scenario 2: Bull Leg Surge
During a strong new bull leg, the % Above 50-DMA might surge above 70% and remain elevated. This indicates broad participation in the market rally, suggesting a healthier trend. Traders can be more open to adding exposure, provided their setups align with the broader market strength.
Scenario 3: Volatility Spike
A sudden increase in geopolitical tensions can lead to a volatility spike, where ATR% jumps significantly. This often coincides with a rising CWI, signaling increased market risk. Traders might feel compelled to exit positions hastily, but a more strategic response would be to reassess risk exposure and consider protective measures.
How to Use This Insight in a Process
- Emphasize Defense: When breadth is weak and the CWI is high, it is prudent to emphasize defensive strategies and reduce new risk.
- Broaden Exposure: When breadth and leadership broaden out, consider increasing exposure, but only if your setups are favorable.
- Use Market Dashboard: Leverage the Market Dashboard as a high-level regime label, then check internals for confirmation before making decisions.
Common Misuses & Misconceptions
Stand-Alone Signal: Some traders treat the CWI as a stand-alone entry signal. Instead, it should be used as part of a broader risk assessment framework.
Ignoring Context: Ignoring sector rotation and time frame can lead to misinterpretation. Always consider the broader market context.
Overreacting to One-Day Changes: Reacting to single-day changes in metrics can lead to whipsawing. Focus on trends and sustained signals instead.
To see these breadth and risk metrics in one place each day, you can use the Decision Edge dashboard at 1marketvibe.com.
Disclaimer: This article is for informational purposes only and should not be considered financial advice. Market conditions can change rapidly, and past performance is not indicative of future results.