
UAE's OPEC Exit Increases Oil Price Uncertainty Amid Iran Conflict
- Authors

- Name
- MarketVibe Team
- @1marketvibe
Understanding the Impact of UAE's OPEC Exit on Oil Price Uncertainty
The recent decision by the United Arab Emirates (UAE) to exit the Organization of the Petroleum Exporting Countries (OPEC) has introduced significant uncertainty into the global oil markets, especially amid ongoing conflicts in the Middle East. This development is crucial for traders to understand, as it affects oil prices and broader market dynamics. In this article, we will explore how this geopolitical shift interacts with MarketVibe's metrics to provide a clearer picture of market conditions and guide trading decisions.
Orientation – What Are We Explaining?
The focus of this article is on understanding how the UAE's exit from OPEC impacts oil price uncertainty and how traders can use MarketVibe's metrics to navigate this environment. The key metrics we will discuss include the Crash Warning Index (CWI), % Above 50-DMA, and ATR%. These indicators help traders assess risk, market breadth, and volatility, respectively.
Why Traders Should Care
- Informed Decision-Making: Understanding these metrics can help traders make more informed decisions about risk exposure and portfolio adjustments.
- Blind Spot Reduction: By integrating these metrics, traders can reduce blind spots related to market breadth and volatility.
- Structured Process: These indicators fit into a structured trading process, providing a framework for assessing market conditions rather than acting as standalone signals.
How It Works – Mechanics & Data
Crash Warning Index (CWI)
The CWI is a composite index that measures several dimensions of market risk, including breadth, volatility, and defensive behavior. It provides an early warning signal for potential market corrections. The CWI is particularly relevant in the current context, with a reading of 5.2, indicating elevated risk levels.
% Above 50-DMA
This metric measures the percentage of stocks trading above their 50-day moving average, offering insights into market breadth and trend health. A higher percentage suggests a strong market trend, while a lower percentage indicates weakness.
ATR%
ATR% measures volatility relative to price, helping traders understand the current volatility regime. High ATR% values often correspond to choppy or unstable market phases, while low values indicate quieter, trending phases.
What Moves These Metrics
- CWI: Influenced by changes in market breadth, volatility spikes, and shifts in defensive sector performance.
- % Above 50-DMA: Affected by broad market movements and sector rotations.
- ATR%: Driven by price fluctuations and market sentiment changes.
Interpretation – What Different Levels Tend to Mean
Crash Warning Index (CWI)
- Below 3: Low risk, stable market conditions.
- 3 to 6: Moderate risk, potential for increased volatility.
- Above 6: High risk, corrections more likely.
% Above 50-DMA
- Above 70%: Strong market trend, bullish conditions.
- 30% to 70%: Neutral, mixed signals.
- Below 30%: Weak market trend, bearish conditions.
ATR%
- Low ATR%: Quiet, trending market phases.
- High ATR%: Volatile, choppy market phases.
Common Combinations
- Strong Breadth + Low Volatility: Favorable for risk-taking.
- Weak Breadth + Rising Volatility: Caution advised, potential for market pullbacks.
Real-World Scenarios – How This Shows Up in Markets
Scenario 1: Topping Environment
In a topping environment, market indices may continue to rise even as breadth deteriorates. Traders might feel tempted to increase exposure, but a high CWI and low % Above 50-DMA would suggest caution. A more informed approach would involve reducing risk and monitoring defensive sectors.
Scenario 2: Bull Market Leg
During a strong bull market leg, the % Above 50-DMA might surge above 70%, indicating robust market health. Traders could consider increasing exposure, provided their setups align with broader market conditions.
Scenario 3: Volatility Spike
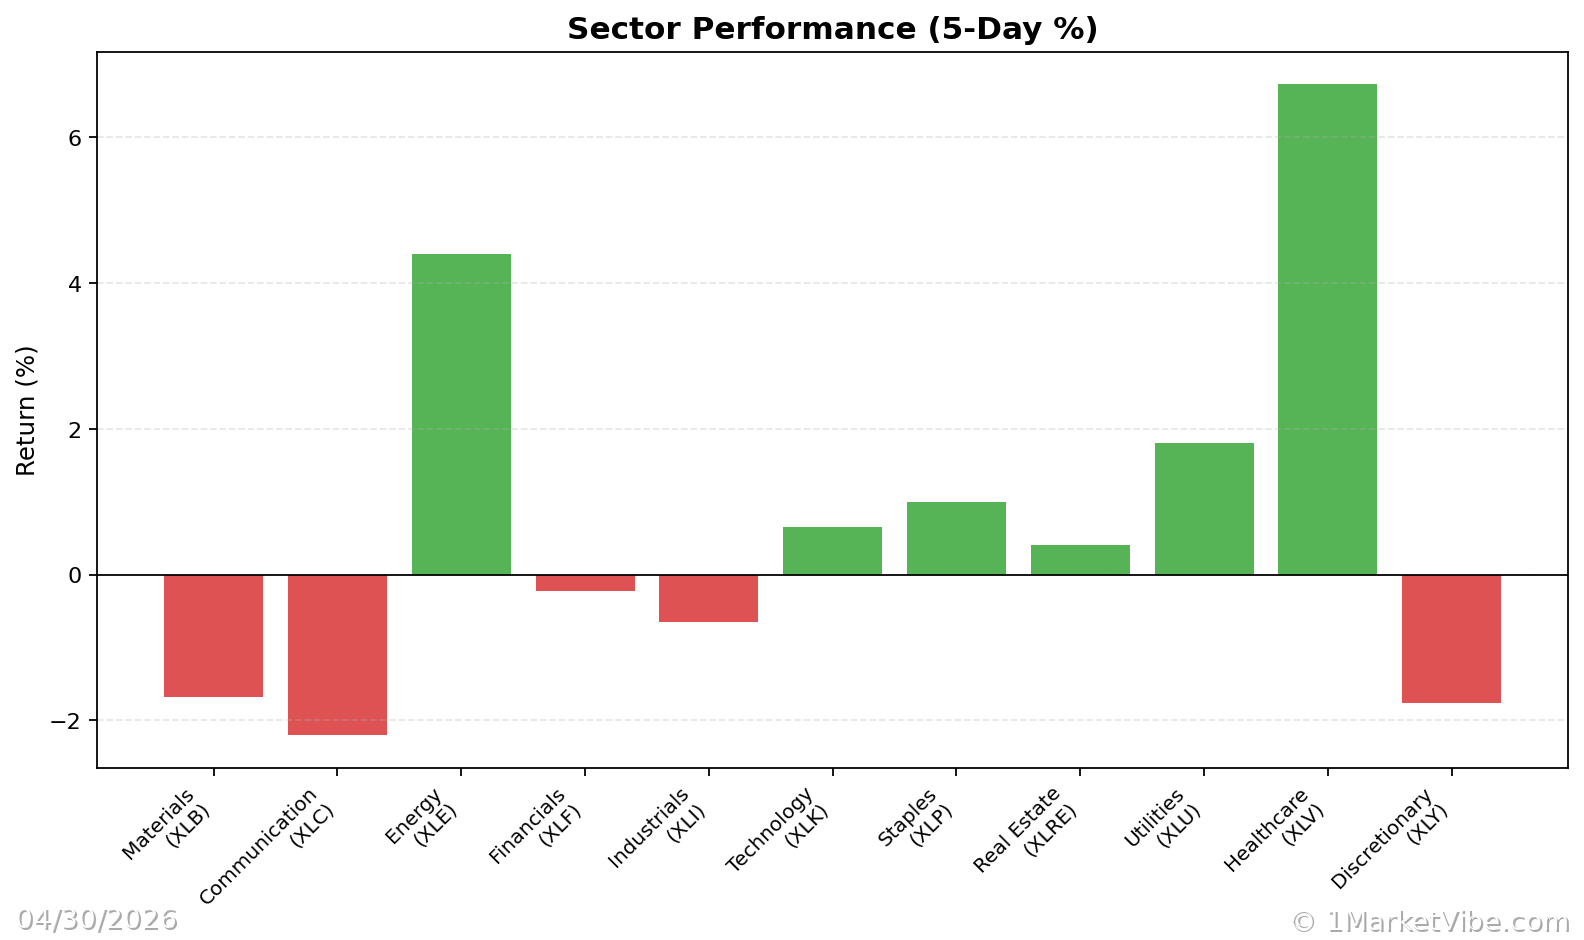
A sudden geopolitical event, such as the UAE's OPEC exit, could lead to a volatility spike, reflected in a rising ATR%. Traders might feel pressured to react quickly, but a high CWI would suggest maintaining a defensive posture until volatility subsides.
How to Use This Insight in a Process
- Emphasize Defense: When breadth is weak and CWI is high, focus on defensive strategies and reduce new risk.
- Broaden Exposure: When breadth and leadership are strong, consider increasing exposure, but only if setups are favorable.
- Use Market Dashboard: Utilize the Decision Edge dashboard to assess overall market climate and confirm internal signals.
Common Misuses & Misconceptions
- Standalone Signals: Avoid treating these metrics as standalone entry signals. They are best used in conjunction with broader market analysis.
- Ignoring Context: Consider sector rotation and time frame when interpreting metrics.
- Overreacting to Changes: Avoid overreacting to one-day changes; focus on trends and sustained movements.
To see these breadth and risk metrics in one place each day, you can use the Decision Edge dashboard at 1marketvibe.com.
DISCLAIMER: This article is for informational purposes only and does not constitute financial advice. Always conduct your own research before making investment decisions.