
China's Ban on Meta's Manus Deal Indicates Shift in Investment Strategy
- Authors

- Name
- MarketVibe Team
- @1marketvibe
China's Ban on Meta's Manus Deal Indicates Shift in Investment Strategy
In recent developments, China's decision to block Meta's acquisition of Manus has sent ripples across the investment landscape, signaling a potential shift in global tech investment strategies. This move is not just about a single deal but reflects broader regulatory trends that could influence market dynamics. Understanding these shifts is crucial for traders and investors aiming to navigate the complexities of the tech sector and global markets.
China's Regulatory Landscape
China's regulatory environment has become increasingly stringent, especially concerning foreign acquisitions and tech investments. The ban on Meta's Manus deal is a part of this broader strategy to exert more control over tech-related transactions. For traders, this highlights the importance of monitoring geopolitical and regulatory developments as they can significantly impact market conditions and investment strategies.
Market Reactions
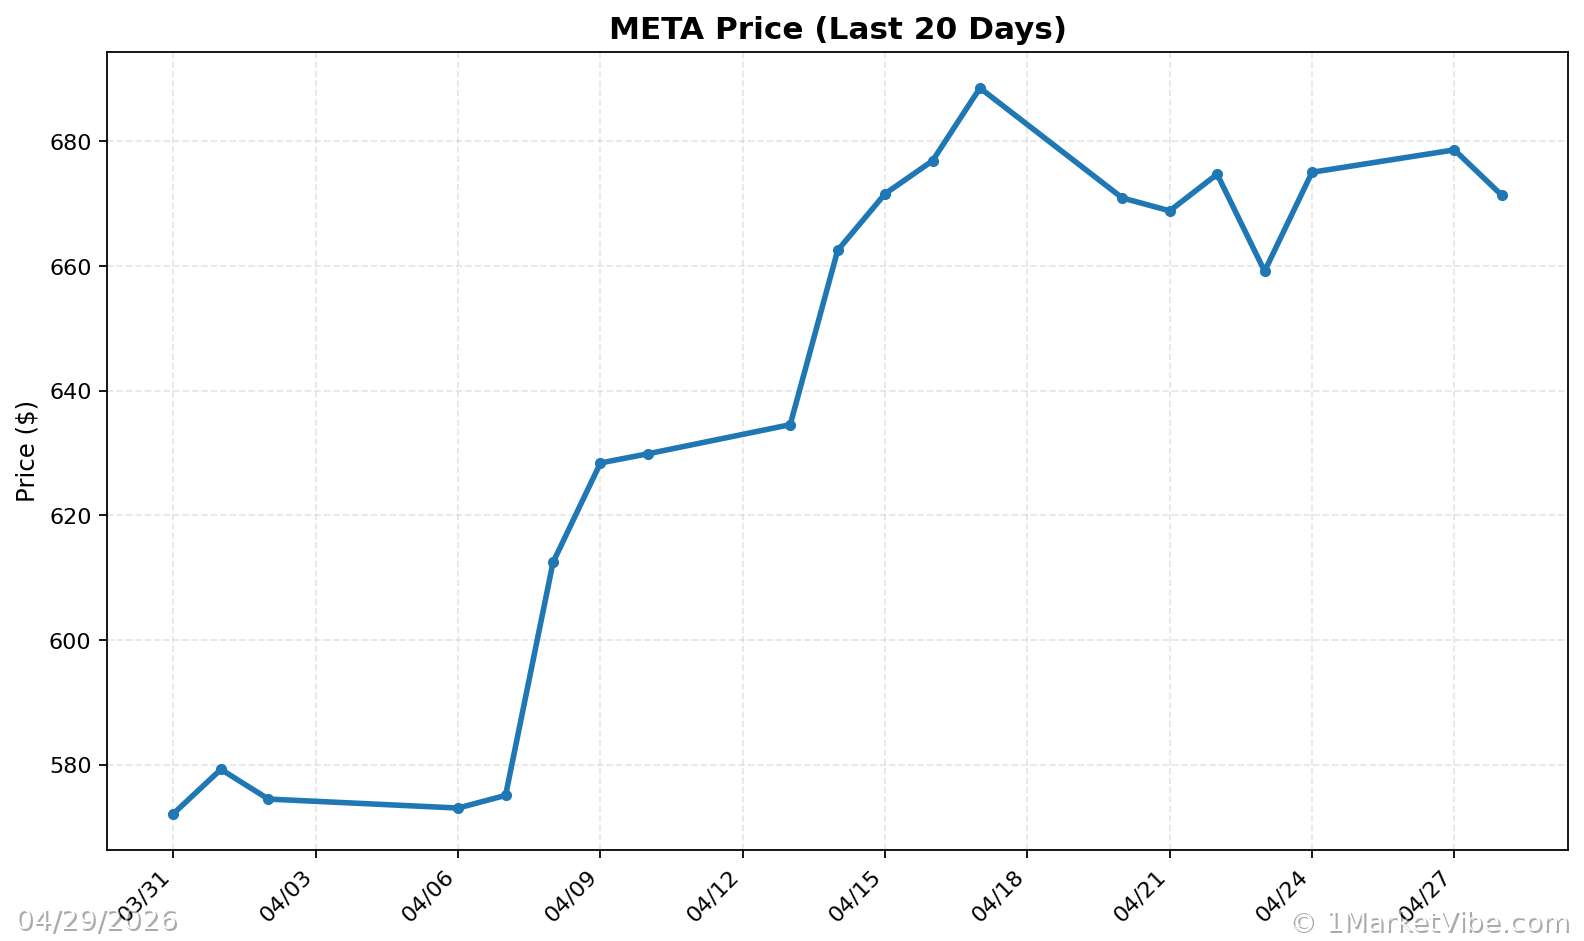
The immediate market reaction to the ban was a mix of caution and recalibration. Tech stocks, particularly those with significant exposure to China, experienced volatility. This scenario underscores the importance of understanding market breadth and volatility metrics, such as the % Above 50-DMA and ATR%, which provide insights into market health and risk levels.
% Above 50-DMA
The % Above 50-DMA is a breadth indicator that measures the percentage of stocks trading above their 50-day moving average. This metric helps traders assess the overall trend health of the market. A high percentage indicates strong market breadth, suggesting a healthy trend, while a low percentage may signal weakness or an oversold condition.
- Example: If the % Above 50-DMA falls below 40%, it typically indicates a weakening market, prompting traders to adopt a more defensive posture.
ATR% (Average True Range Percentage)
ATR% measures market volatility relative to price. It provides insights into the current volatility regime, helping traders adjust their risk management strategies.
- Example: A rising ATR% suggests increasing volatility, which may warrant tighter risk controls or reduced position sizes.
Strategic Implications for Meta
For Meta, the blocked acquisition represents a strategic challenge, necessitating a reevaluation of its investment and expansion strategies. This situation highlights the importance of sector leadership and rotation, as companies must adapt to changing regulatory and market conditions.
Sector Scores
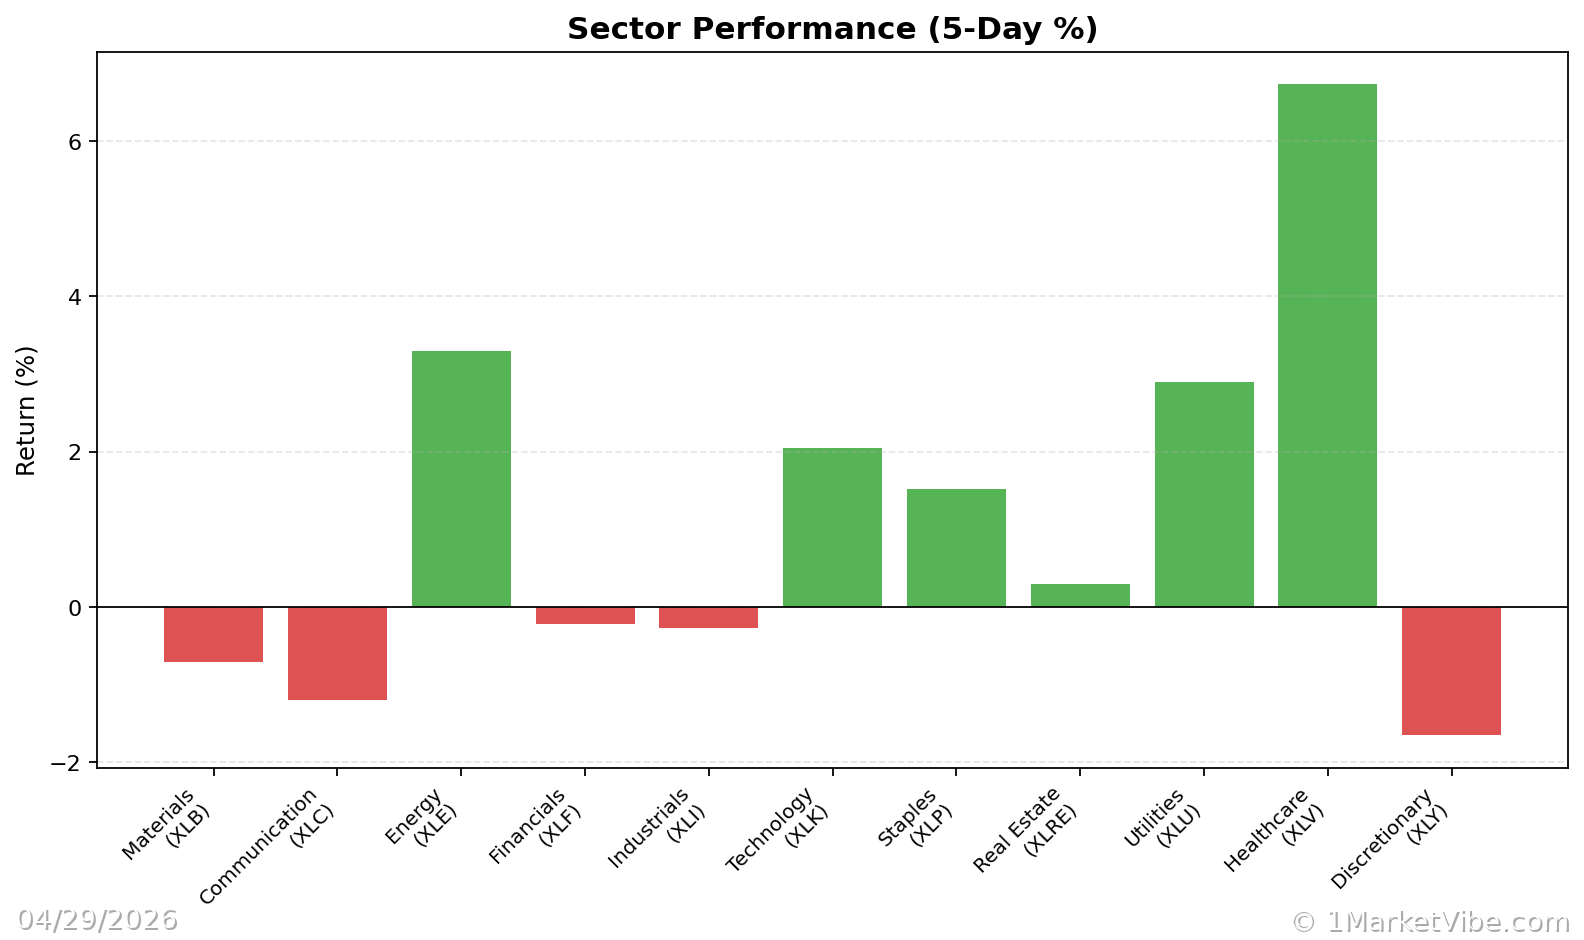
MarketVibe's Sector Scores provide insights into leadership and rotation within the market. By analyzing which sectors are leading or lagging, traders can better position themselves to capitalize on emerging trends.
- Example: If defensive sectors like utilities and consumer staples begin to lead, it may indicate a shift towards risk aversion in the market.
Broader Tech Investment Trends
The implications of China's regulatory stance extend beyond Meta, affecting broader tech investment trends. Traders should consider how these developments might influence sector performance and global tech market dynamics.
New High–New Low (NH–NL) Expansion vs. Contraction
The NH–NL indicator tracks the number of stocks making new highs versus new lows. Expansion in new highs suggests strong market momentum, while contraction may indicate a potential reversal or consolidation phase.
- Example: A contraction in NH–NL during a regulatory crackdown could signal caution, prompting traders to reassess their tech sector exposure.
Real-World Scenarios
To illustrate how these metrics interact in real-world scenarios, consider the following:
Topping Environment: As market breadth deteriorates with a declining % Above 50-DMA, the index might still grind higher, creating a false sense of security. Traders should remain vigilant and consider defensive strategies.
Volatility Spike: A sudden increase in ATR% alongside a high CWI (Crash Warning Index) could indicate heightened risk, suggesting traders tighten risk controls and avoid new positions until volatility stabilizes.
Bullish Momentum: A surge in % Above 50-DMA, coupled with strong NH–NL expansion, may signal a robust bull leg, encouraging traders to increase exposure if their setups align with market conditions.
How to Use This Insight in a Process
To effectively incorporate these insights into your trading process, consider the following guidelines:
- Emphasize Defense: When market breadth is weak and CWI is high, prioritize defensive strategies and reduce new risk exposure.
- Broaden Exposure: As breadth and leadership improve, be open to increasing exposure, provided your setups are favorable.
- Monitor Regimes: Use the Market Dashboard to identify high-level regime labels, then confirm with internal metrics like % Above 50-DMA and ATR%.
Common Misuses & Misconceptions
Traders often misuse these metrics by:
- Treating as Stand-Alone Signals: Avoid using any single metric as a definitive entry or exit signal. Instead, use them as part of a broader analysis framework.
- Ignoring Context: Consider sector rotation and broader market conditions when interpreting metrics.
- Overreacting to Daily Changes: Focus on trends and sustained movements rather than reacting to one-day fluctuations.
To see these breadth and risk metrics in one place each day, you can use the Decision Edge dashboard at 1marketvibe.com.
DISCLAIMER: This article is for informational purposes only and should not be considered financial advice. Always conduct your own research and consult with a financial advisor before making investment decisions.