SpaceX IPO Signals and Its Implications for Investors
The anticipated SpaceX IPO, valued at an impressive $1.75 trillion, has captured the attention of investors worldwide. As one of the most significant events in the aerospace sector, understanding its implications is crucial for informed investment decisions. This article will explore how the SpaceX IPO might influence market dynamics, investor behavior, and broader economic trends, using MarketVibe's metrics to provide a structured analysis.
Understanding the Market Dynamics Shift
Potential Changes in Investor Behavior
The SpaceX IPO is not just another listing; it's a transformative event that could reshape investor behavior. Historically, large IPOs have led to shifts in capital allocation, as investors seek to position themselves in promising new ventures. The sheer size of SpaceX's IPO suggests it could attract significant funds, potentially impacting liquidity in other sectors.
Impact on Existing Aerospace Stocks
Existing aerospace stocks may experience increased volatility as investors reassess their portfolios. Companies with direct or indirect ties to SpaceX could see heightened interest, while others may face selling pressure. This reallocation could be tracked using MarketVibe's % Above 50-DMA metric, which measures the percentage of stocks trading above their 50-day moving average. A decline in this metric across the aerospace sector might indicate a shift in investor focus towards SpaceX.
Investment Opportunities and Risks
Identifying Beneficiaries
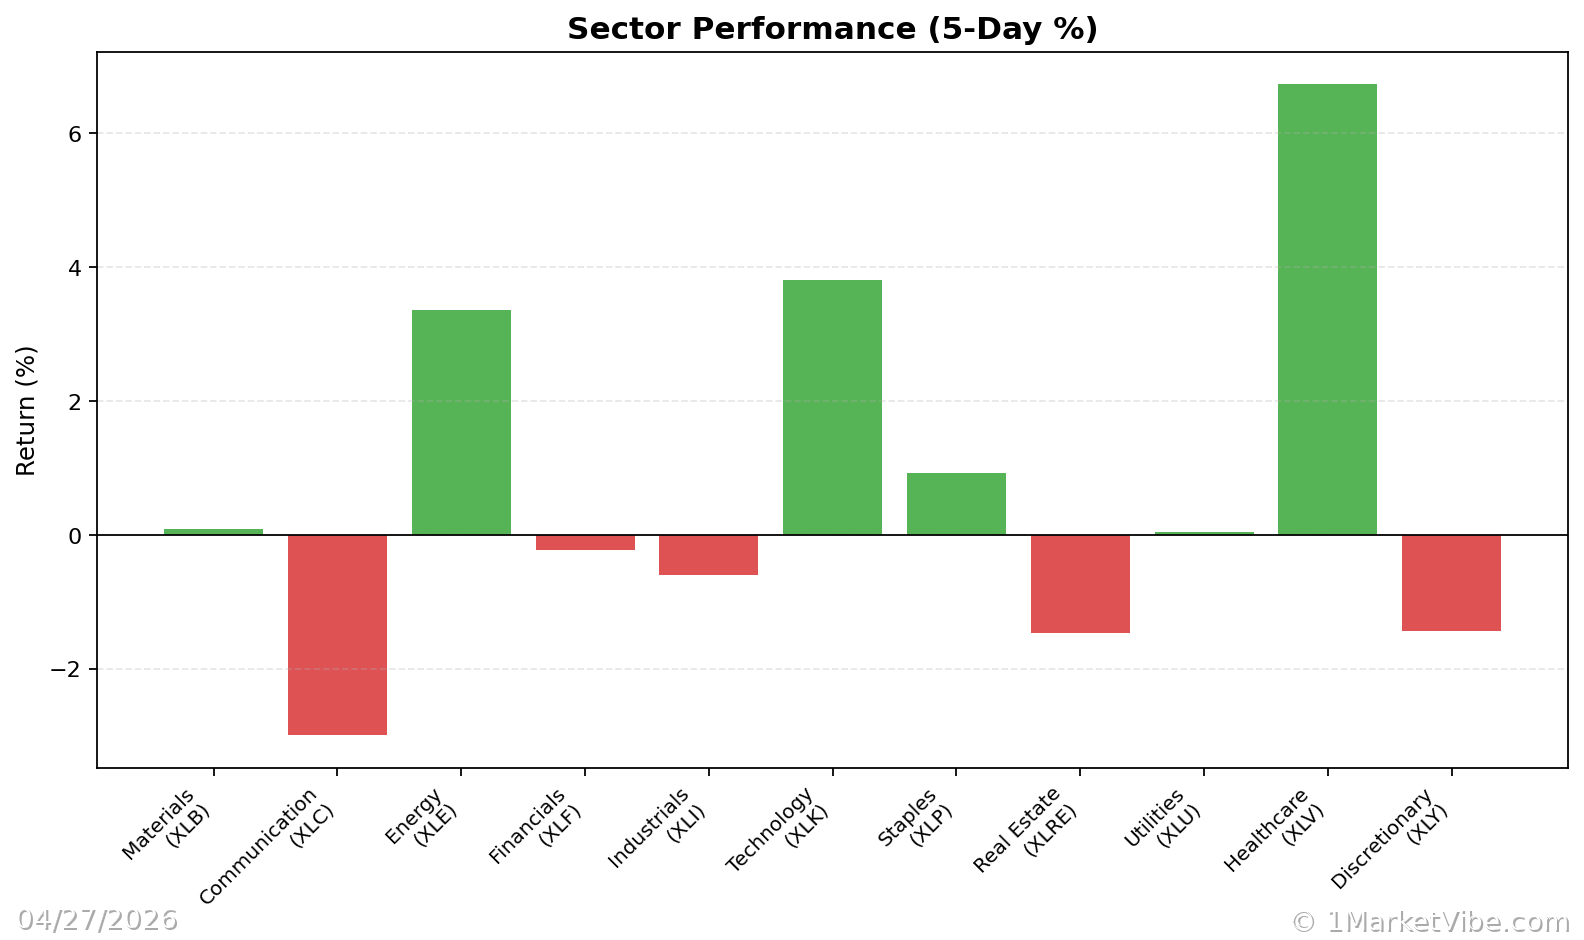
Investors looking to capitalize on the SpaceX IPO should consider stocks that could benefit from its success. These might include suppliers, technology partners, or companies in related sectors like satellite communications. Using MarketVibe's Sector Scores, investors can identify which sectors are gaining leadership and potentially benefiting from SpaceX's market entry.
Market Volatility and Its Effects
The introduction of a major IPO like SpaceX often leads to increased market volatility. This can be measured using the ATR% (Average True Range Percentage), which gauges volatility relative to price. A spike in ATR% following the IPO could signal a more turbulent market environment, requiring investors to adjust their risk management strategies accordingly.
Comparative Analysis with Past IPOs
Lessons from Previous High-Profile IPOs
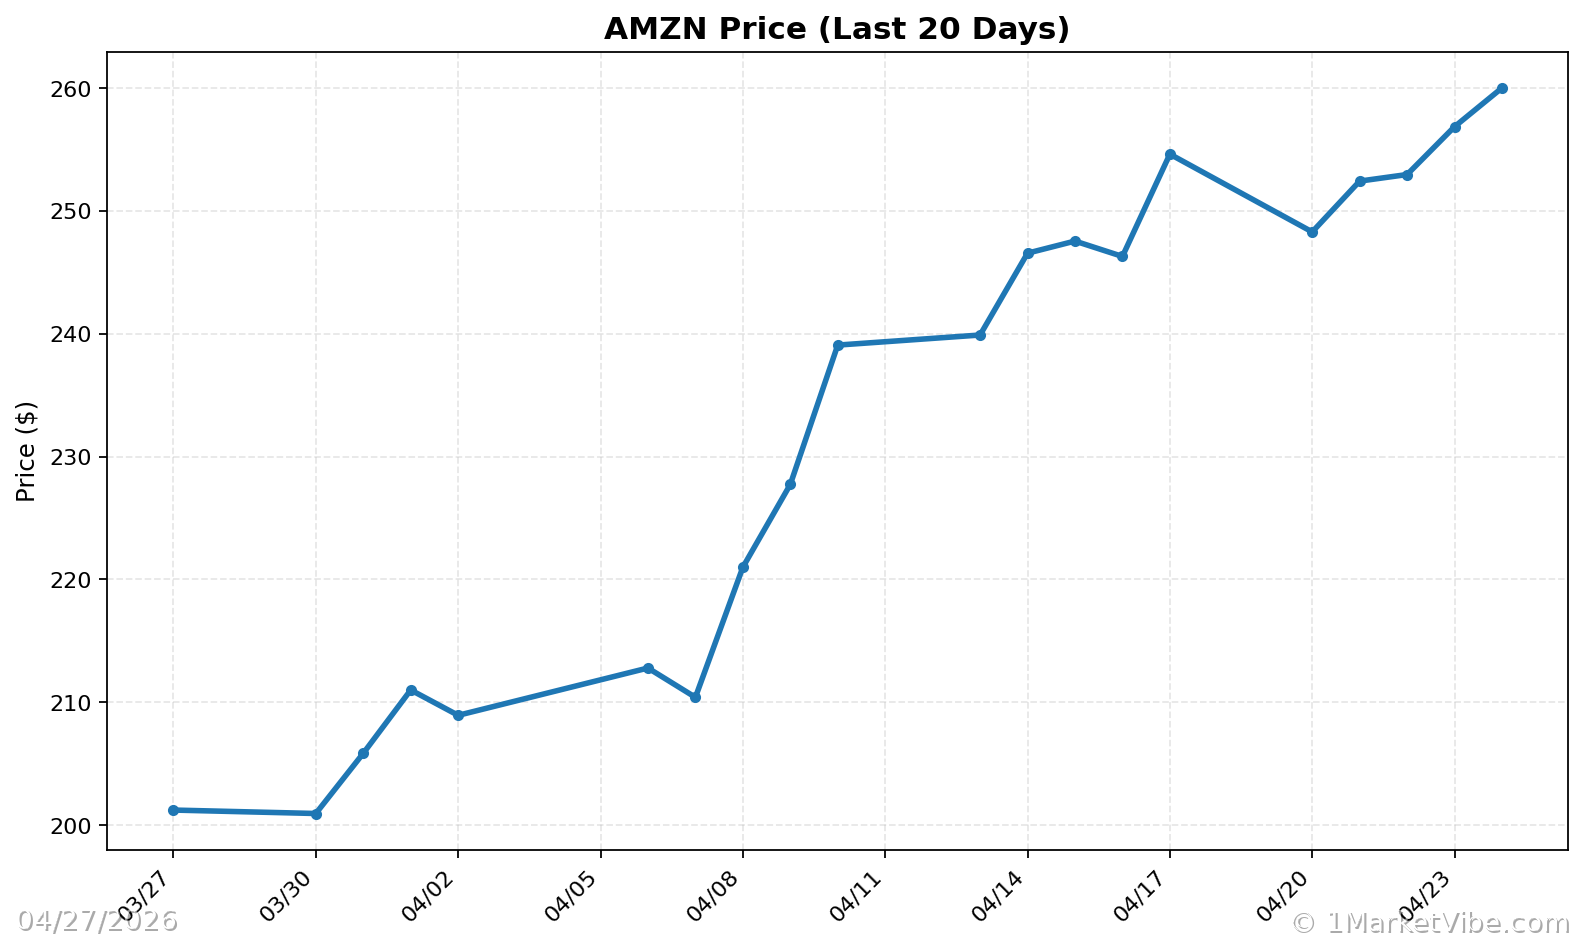
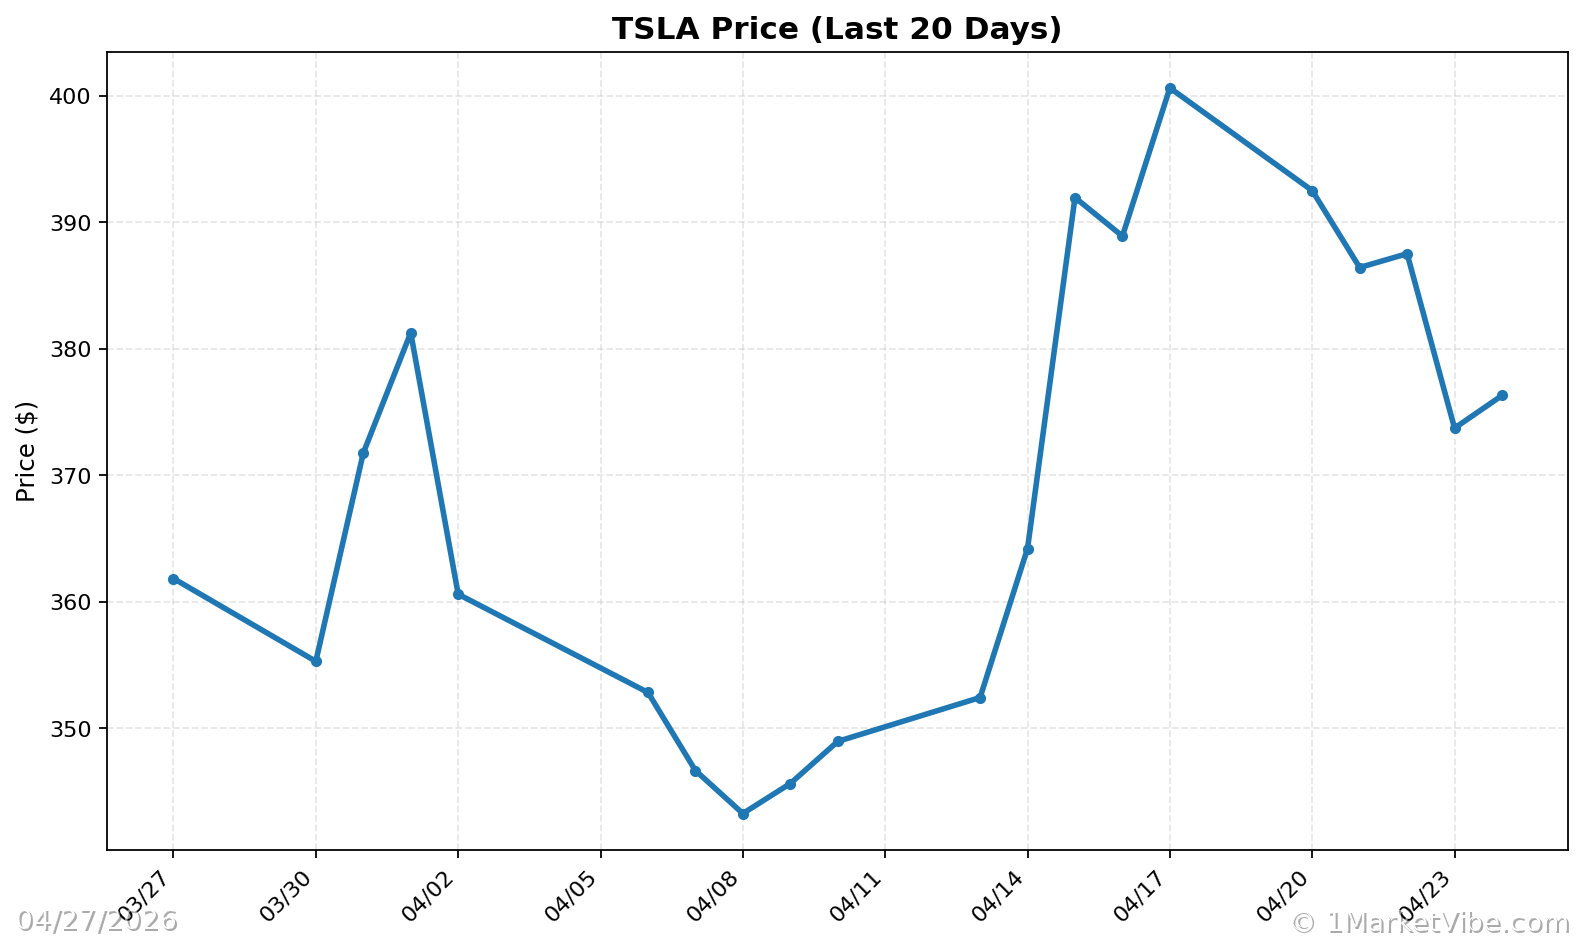
Looking at past high-profile IPOs in the tech and aerospace sectors can provide valuable insights. For instance, the IPOs of companies like Tesla and Amazon initially faced skepticism but ultimately reshaped their respective industries. By comparing the CWI (Crash Warning Index) during these periods, investors can gauge the risk environment surrounding SpaceX's IPO. A CWI reading above 6, for instance, would suggest elevated risk levels, similar to those seen in past volatile IPO periods.
Real-World Scenarios
Scenario 1: Topping Environment
Imagine a scenario where the broader market is grinding higher, but breadth metrics like % Above 50-DMA are deteriorating. This could indicate a topping environment, where enthusiasm for SpaceX overshadows underlying market weakness. In such cases, traders might feel tempted to chase the rally, but a more informed approach would be to monitor breadth closely and remain cautious.
Scenario 2: Strong Bull Leg
Conversely, if the SpaceX IPO coincides with a surge in % Above 50-DMA, it could signal the start of a strong bull leg. This would suggest broad market participation and a healthier trend, encouraging traders to add exposure, provided their setups align with this broader strength.
Scenario 3: Volatility Spike
A sudden increase in ATR% post-IPO might indicate a volatility spike, reflecting market uncertainty. Traders might instinctively react by reducing positions, but understanding the context—such as a temporary adjustment period following the IPO—could lead to more strategic decisions, like employing hedging strategies.
How to Use This Insight in a Process
Practical Guidelines
- Emphasize Defense: When breadth is weak and CWI is high, prioritize defensive strategies and reduce new risk exposure.
- Broaden Exposure: If breadth and leadership metrics improve, consider increasing exposure, but only if your setups confirm the broader trend.
- Monitor the Market Dashboard: Use MarketVibe's Decision Edge dashboard to label the market regime and confirm internal metrics before making decisions.
Common Misuses & Misconceptions
Misuse 1: Stand-Alone Signals
Traders often misuse metrics like % Above 50-DMA as stand-alone entry signals. Instead, these should be part of a broader analysis that includes context and confirmation from other indicators.
Misuse 2: Ignoring Context
Ignoring sector rotation or broader market trends can lead to poor decisions. Always consider the broader context, such as leadership changes indicated by Sector Scores.
Misuse 3: Overreacting to One-Day Changes
Reacting to single-day metric changes can lead to whipsaw effects. Focus on sustained trends and confirmation across multiple days to guide decisions.
To see these breadth and risk metrics in one place each day, you can use the Decision Edge dashboard at 1marketvibe.com.
Disclaimer: This article is for informational purposes only and does not constitute financial advice. Market conditions can change rapidly, and past performance is not indicative of future results.
Charts