


Soft Inflation Data Drives Stock Market Rally
The recent rally in the stock market has been largely driven by softer-than-expected inflation data, which has significant implications for traders and investors. Understanding how inflation data impacts market dynamics is crucial for making informed decisions. In this article, we'll explore the mechanics of inflation data, its influence on market behavior, and how traders can use MarketVibe's metrics to navigate these changes effectively.
Inflation Data and Its Importance
Inflation data refers to the rate at which the general level of prices for goods and services is rising, and subsequently, how purchasing power is falling. Central banks, like the Federal Reserve in the U.S., use inflation data to guide monetary policy decisions, such as setting interest rates. For traders, inflation data can inform decisions about market exposure and risk management.
When inflation is lower than expected, it suggests that the economy might not be overheating, reducing the pressure on central banks to raise interest rates. This can lead to a more favorable environment for stocks, as lower interest rates generally support higher equity valuations.
How Inflation Data Works
Inflation is typically measured by indices such as the Consumer Price Index (CPI) and the Producer Price Index (PPI). These indices track changes in the price of a basket of goods and services over time. For example, the recent report showed a 0.3% decline in the PPI for June, which was unexpected as economists had predicted no change. This softer inflation reading suggests that price pressures are easing, potentially delaying further rate hikes by the Fed.
Day-to-day, inflation data can move markets by influencing expectations about future interest rates. If traders anticipate that the Fed will be less aggressive with rate hikes, they may be more willing to take on risk, driving stock prices higher.
Interpreting MarketVibe Metrics in the Context of Inflation
MarketVibe offers several metrics that can help traders understand market conditions in light of inflation data:
- Crash Warning Index (CWI): A composite measure that includes factors like breadth and volatility. A lower CWI suggests reduced risk of a market correction, which might align with softer inflation data.
- % Above 50-DMA: This breadth indicator shows the percentage of stocks trading above their 50-day moving average. A high percentage indicates strong market breadth, often seen in rallies following positive inflation news.
- ATR% (Average True Range Percentage): Measures market volatility relative to price. Lower ATR% values can indicate a stable, trending market, which might be expected if inflation fears subside.
Real-World Scenarios
Let's consider a few scenarios to illustrate how these metrics interact with inflation data:
Rally on Softer Inflation:
- Metrics: High % Above 50-DMA, Low CWI, Low ATR%
- Market Reaction: Stocks rally as traders anticipate less aggressive Fed action. Breadth is strong, and volatility is low, suggesting a stable uptrend.
- Trader Response: Consider increasing exposure to equities, focusing on sectors benefiting from lower rates, like technology.
Volatility Spike on Inflation Surprise:
- Metrics: Rising ATR%, High CWI
- Market Reaction: A surprise uptick in inflation could lead to increased volatility and a higher CWI, indicating elevated risk.
- Trader Response: Emphasize defensive strategies, reduce exposure to high-beta stocks, and consider hedging.
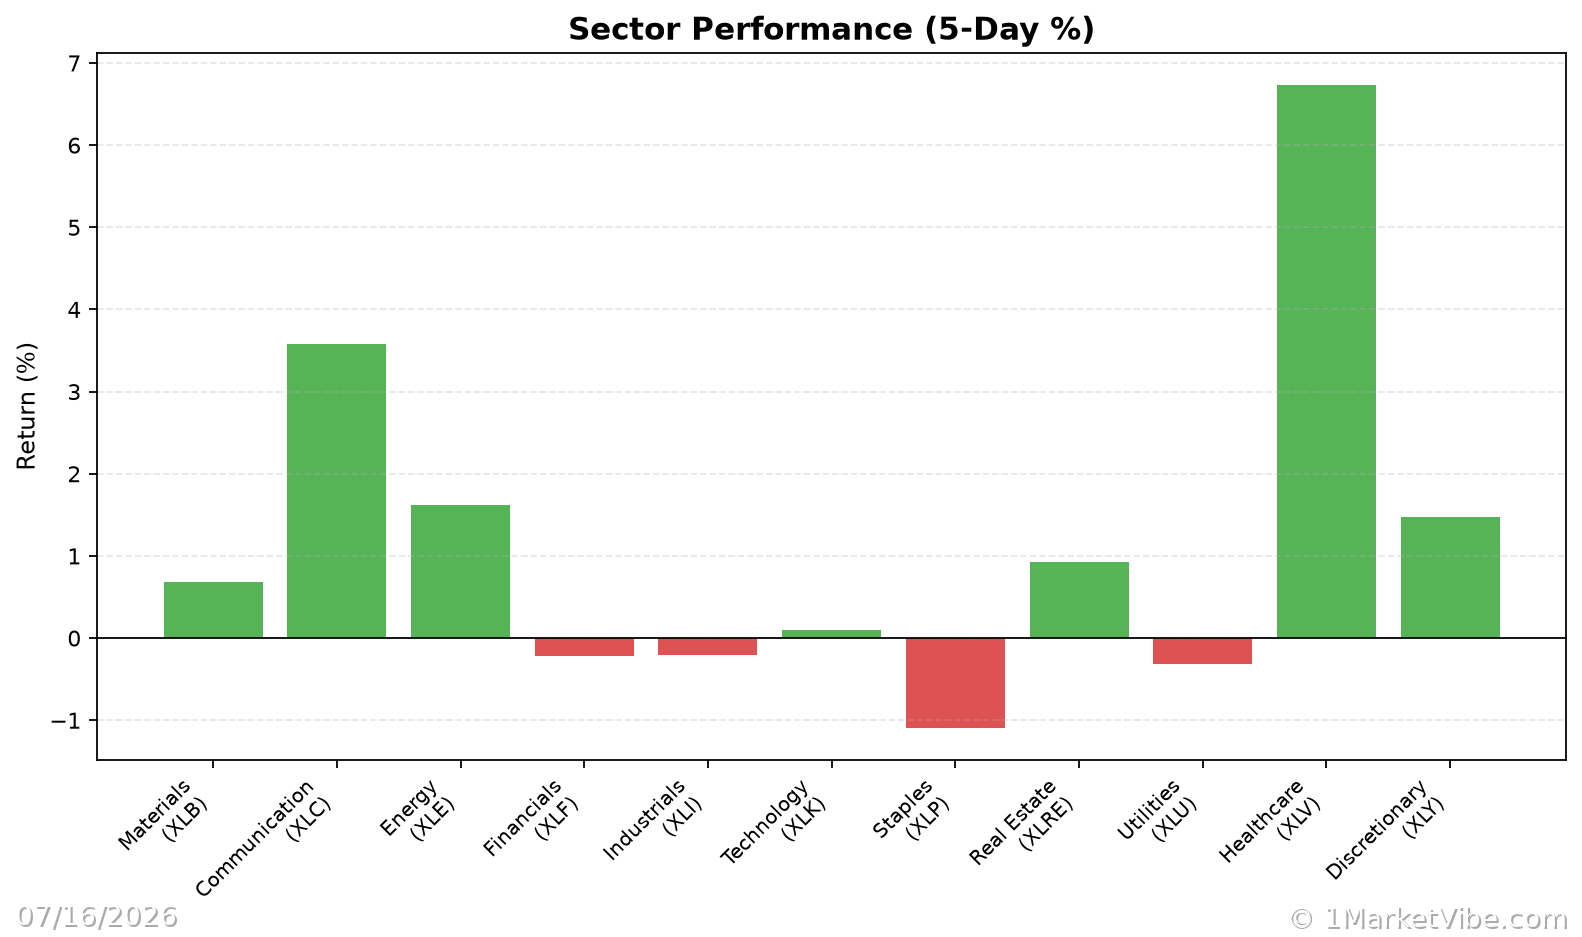
Sector Rotation Amid Inflation Concerns:
- Metrics: Mixed % Above 50-DMA across sectors
- Market Reaction: As inflation data fluctuates, some sectors (e.g., consumer staples) may outperform while others (e.g., discretionary) lag.
- Trader Response: Adjust sector allocations based on relative strength and inflation sensitivity.
Incorporating Insights into a Trading Process
To effectively use these insights, traders should integrate MarketVibe metrics into their broader decision-making framework:
- Monitor Breadth and Volatility: Use % Above 50-DMA and ATR% to gauge market health and adjust risk exposure accordingly.
- Align with Market Regimes: Use the Market Dashboard to identify current market regimes and confirm with internal metrics like CWI.
- Adjust Exposure Based on Inflation Trends: Be more open to adding exposure when inflation data supports a dovish Fed stance, but remain cautious if inflation surprises to the upside.
Common Misuses and Misconceptions
Traders often make mistakes when interpreting inflation data and related metrics:
- Overreacting to One-Day Changes: Inflation data can be volatile; focus on trends rather than single reports.
- Ignoring Sector Dynamics: Inflation impacts sectors differently; consider sector rotation in response to inflation trends.
- Treating Metrics as Stand-Alone Signals: Use metrics as part of a comprehensive analysis, not as isolated trading signals.
To see these breadth and risk metrics in one place each day, you can use the Decision Edge dashboard at 1marketvibe.com.
This article is for informational purposes only and does not constitute financial advice. Always conduct your own research before making investment decisions.