
Oil Surge Drives S&P Toward Correction: Key Insights for Investors
- Authors

- Name
- MarketVibe Team
- @1marketvibe
Oil Surge Drives S&P Toward Correction: Key Insights for Investors
In recent weeks, the financial markets have been grappling with a significant surge in oil prices, which has pushed the S&P 500 closer to correction territory. This development has raised concerns among investors about market stability and potential risks. In this article, we will explore how the rise in oil prices impacts the S&P 500 and what key insights investors can draw from MarketVibe's metrics to navigate this environment effectively.
Orientation – What Are We Explaining?
The primary focus of this discussion is the Crash Warning Index (CWI) and its role in assessing market risk in the context of rising oil prices. The CWI is a composite metric that evaluates several dimensions of market risk, including breadth, volatility, and defensive behavior. Understanding the CWI is crucial for traders as it helps inform decisions about risk management and portfolio adjustments. It reduces blind spots by providing a structured view of market conditions, rather than relying on isolated signals.
How It Works – Mechanics & Data
The Crash Warning Index (CWI) is constructed by aggregating data from various market indicators that reflect different aspects of risk:
- Breadth: This includes metrics like the % Above 50-DMA, which measures the percentage of stocks trading above their 50-day moving average. A lower percentage indicates weaker market breadth.
- Volatility: Measured by ATR% (Average True Range as a percentage of price), which indicates the level of market volatility. Higher ATR% suggests more volatile market conditions.
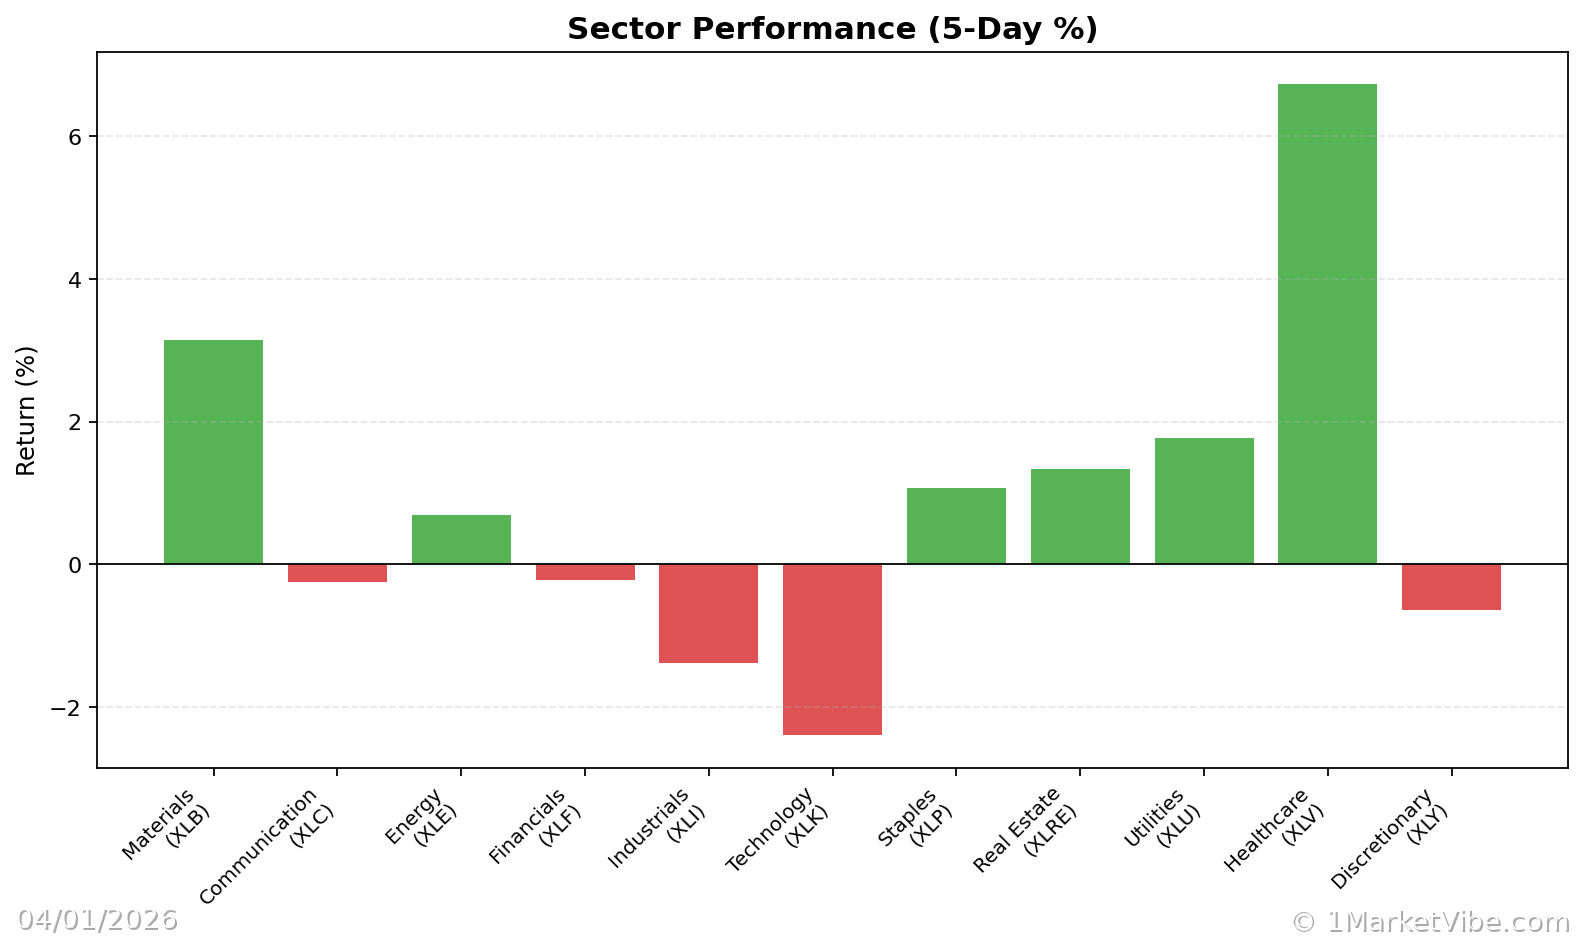
- Defensive Behavior: Observed through sector performance, where defensive sectors like utilities and consumer staples may outperform during risk-off periods.
The CWI moves based on changes in these underlying components. For example, a decline in breadth or an increase in volatility can push the CWI higher, signaling elevated market risk.
Interpretation – What Different Levels Tend to Mean
CWI Levels and Implications:
- Below 3: Generally indicates a stable market environment with lower risk of correction.
- 3 to 6: Suggests caution as risk factors are rising, but not yet at critical levels.
- Above 6: Signals heightened risk, where market corrections become more likely.
Common Combinations:
- Weak Breadth + Rising Volatility: Typically seen in topping environments where the index may still rise, but fewer stocks participate.
- Strong Breadth + Low Volatility: Often indicative of a healthy bull market phase.
Real-World Scenarios – How This Shows Up in Markets
Scenario 1: Topping Environment
Imagine a scenario where the S&P 500 continues to climb, but the % Above 50-DMA drops below 40%. At the same time, ATR% begins to rise, indicating increased volatility. The CWI moves above 6, suggesting a potential market top. Traders might feel tempted to chase the rally, but a more informed view would emphasize caution and risk management.
Scenario 2: Volatility Spike
Consider a situation where geopolitical tensions cause a sudden spike in oil prices, leading to increased market volatility. The ATR% jumps significantly, and the CWI accelerates past 7. In this case, traders might panic and sell indiscriminately. However, understanding the CWI's warning could lead to more strategic risk adjustments, such as hedging or reducing exposure to high-beta stocks.
Scenario 3: Bull Market Leg
In a strong bull market leg, the % Above 50-DMA might surge above 70%, while ATR% remains low. The CWI stays below 3, indicating a stable environment. Traders might be tempted to increase exposure aggressively, but a disciplined approach would still involve monitoring for any signs of breadth deterioration.
How to Use This Insight in a Process
- Emphasize Defense: When breadth is weak and the CWI is high, prioritize defensive strategies and reduce new risk exposure.
- Broaden Exposure: If breadth and leadership improve, consider adding exposure, but only if your setups align with your strategy.
- Use Market Dashboard: Employ the Market Dashboard as a high-level regime label, then delve into internals for confirmation.
Common Misuses & Misconceptions
Treating CWI as a Stand-Alone Signal: Avoid using the CWI as a sole entry or exit signal. It should be part of a broader analysis.
Ignoring Context: Consider sector rotation and time frame when interpreting CWI. Context matters.
Overreacting to One-Day Changes: Focus on trends rather than daily fluctuations to avoid knee-jerk reactions.
To see these breadth and risk metrics in one place each day, you can use the Decision Edge dashboard at 1marketvibe.com.
DISCLAIMER: This article is for informational purposes only and does not constitute financial advice. Please consult with a financial advisor before making investment decisions.